Context
This project is for Kelvin, an industrial automation company. Some key background info:
- Plunger lifts are used in natural gas wells to increase production.
- Kelvin has sensors on each well that detect gas flow, pressure, vibrations, and other data.
- The Kelvin data science team writes control models that optimize production by controlling plunger cycles.
The Kelvin Application
Before this project began, the Kelvin app was a monitoring and ticketing system for oil and gas. We supported 3 main personas for our clients:
Pumper
Creates daily reports for ~30 wells based on what he sees in the field
Performs routine well maintenance, adjusts new wells and recommends equipment changes
Cares about identifying issues early
Optimizer
Diagnoses systemic defects for ~300 wells based on analysis of charts & logs
Adjusts valve open/close criteria and recommends equipment changes
Cares about deviation from expected production
Optimization Lead
Oversees a team of 5-10 optimizers
Calculates ROI by comparing production, touchpoints, & equipment costs
Cares about the success of the Kelvin pilot
Building a Control Platform
We needed to make a pivot in order to scale as a company:
- Monitoring's nice, but clients want automation
- Our existing control models are custom made. We spend a ton of internal resources building and tweaking them.
- We don’t want to be tied to the oil & gas industry
- Eventually, we want to empower clients to manage their own control models. As a first step, we need to make this process easier for our internal team.
This was an ambitious set of goals. The design team's biggest initial questions we had were:
- How do we add immediate value, while moving toward our longterm goal?
- What control models do we have now and what do they actually do?
- What users and use cases should we focus on?
- How does our data team manage models today?
User Research
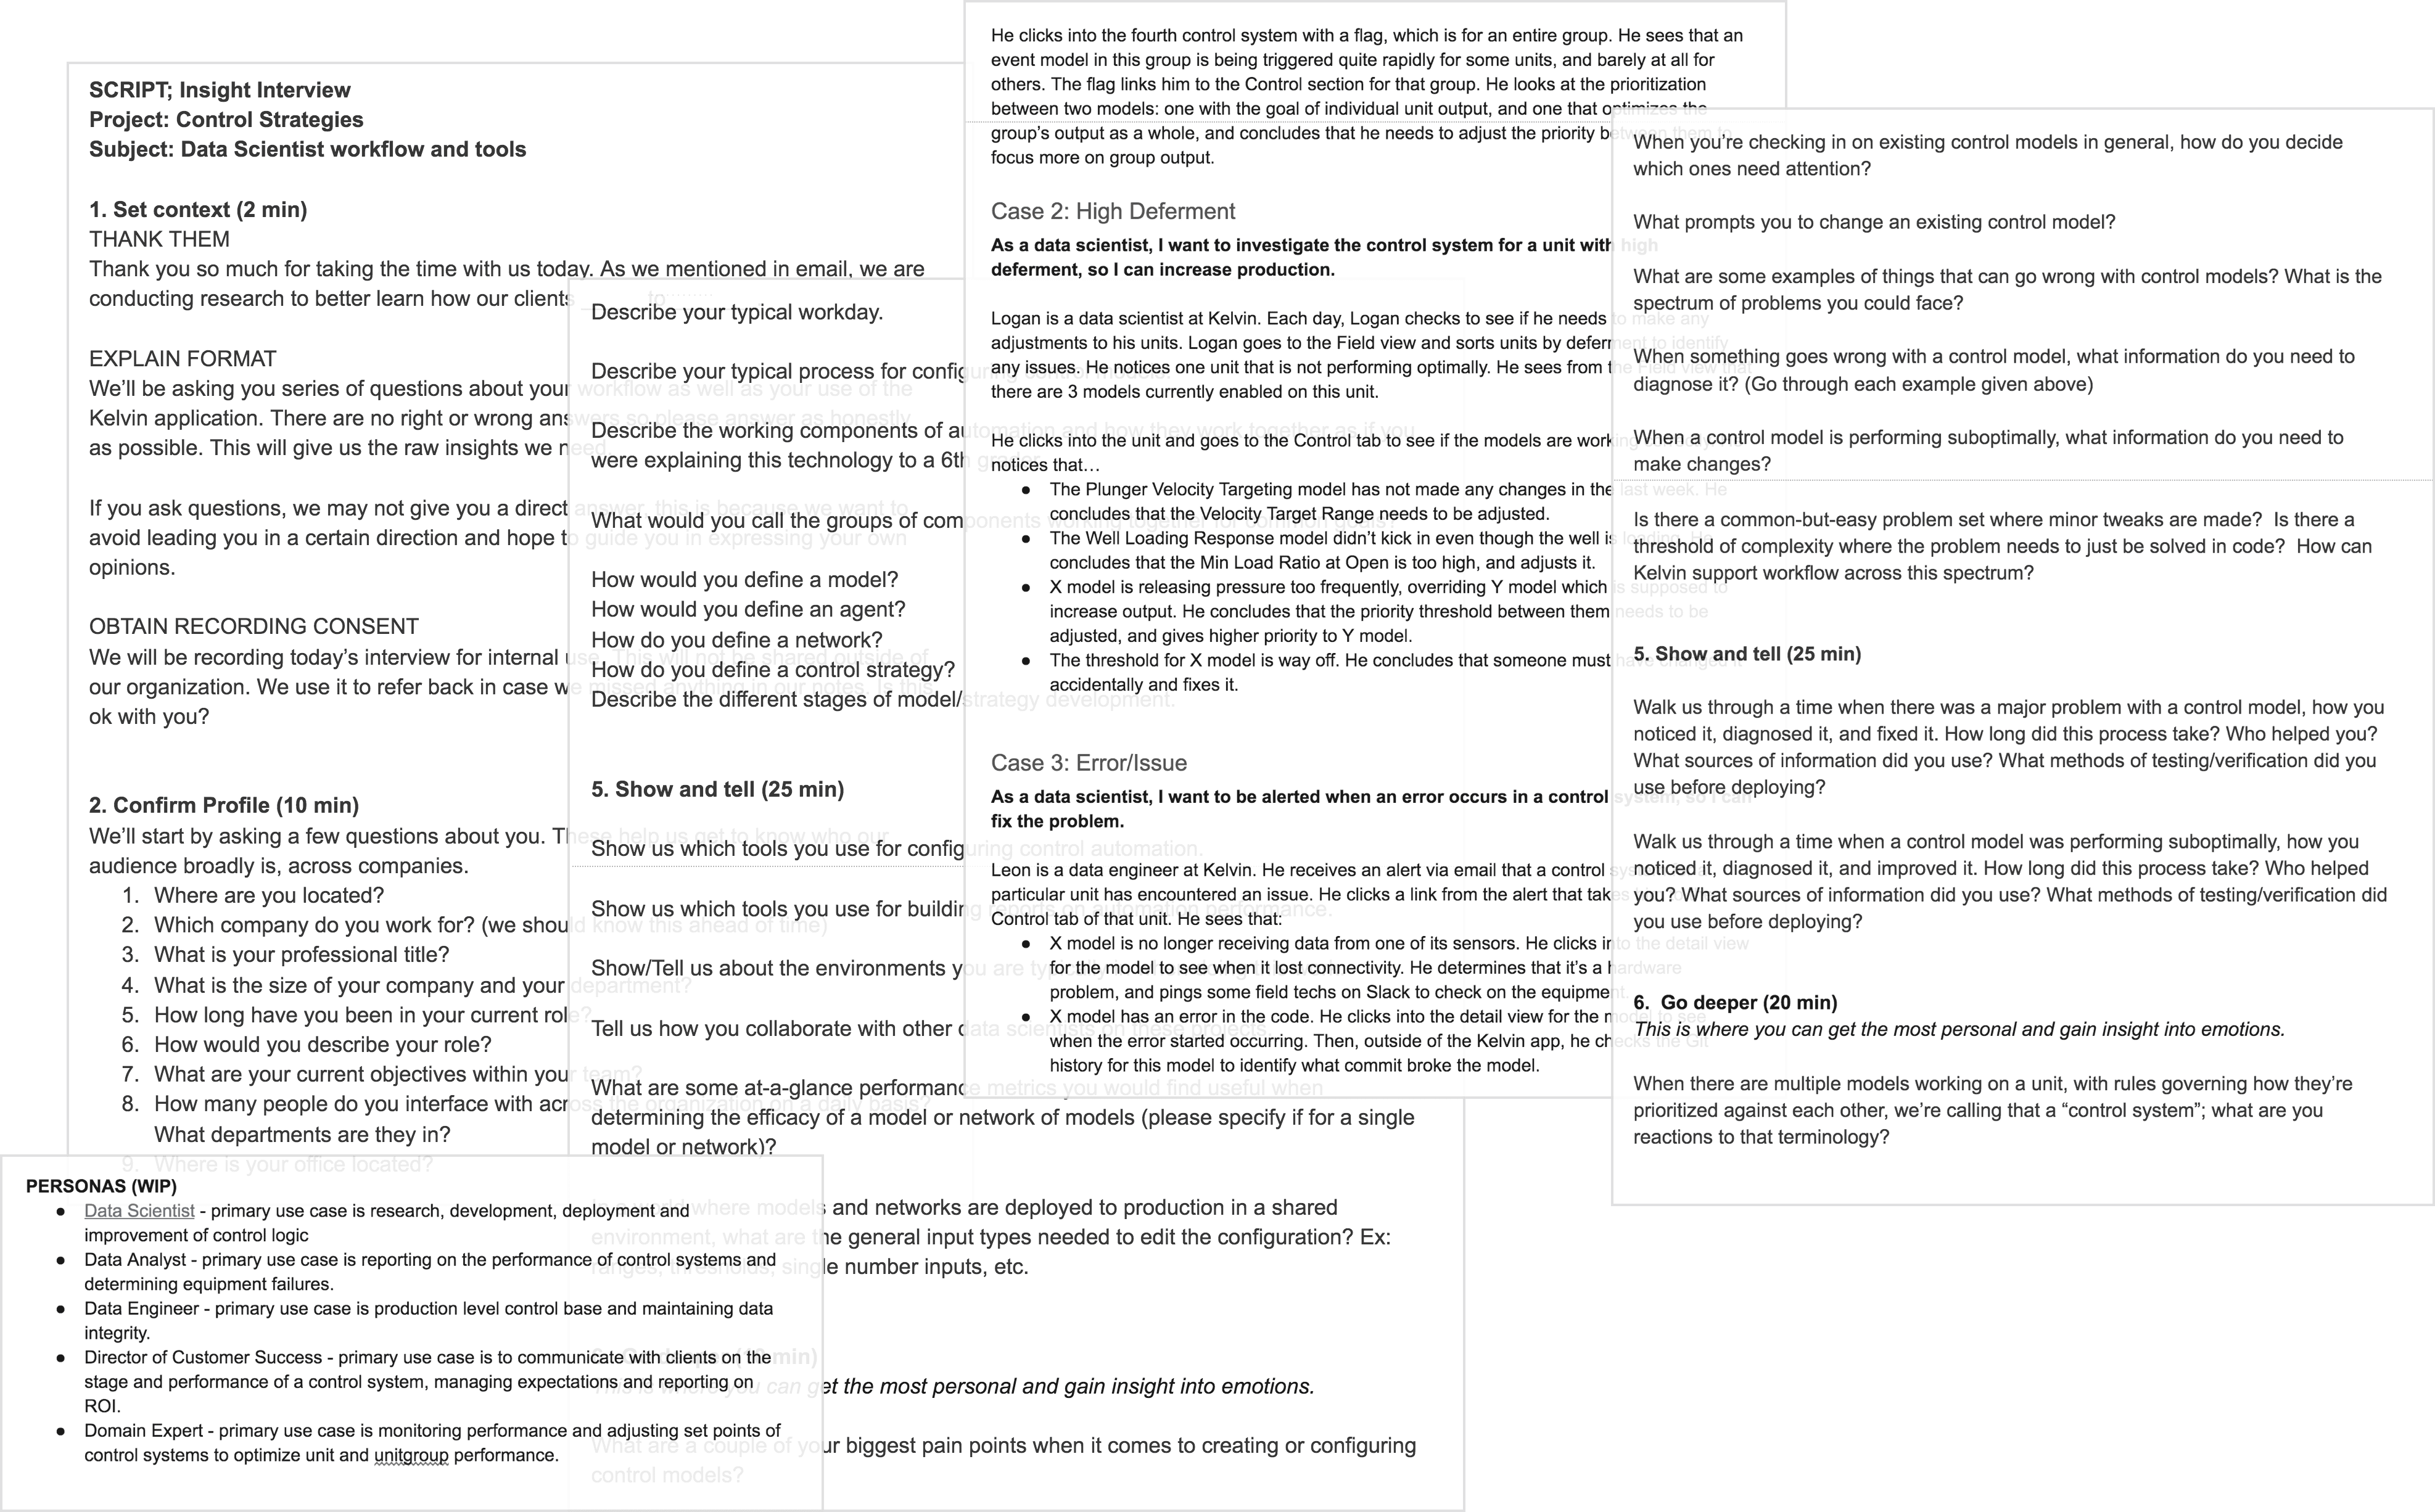
We interviewed 8 data team members to better understand their workflow.
When we started, we didn't know a lot about how control models work on our team. These were our takeaways:
- Control models are independent blocks of code that react when a well is not running optimally. They make changes in response to certain thresholds in our sensor data.
- Thresholds and responses can be tuned according to the needs of individual wells through configurable model parameters.
- Models are semi-automated: when they’re applied to new wells, there is a period of manually tweaking parameters before they can run on their own.
The Target User
Initially we thought the target user was a "member of the data science team." When we dug in we realized that we needed to get more specific than that.
- The data team is comprised of a wide variety of user types with different workflows and areas of expertise.
- Two data team members are former optimizers at energy companies. They have deep domain knowledge but they don't code.
- They find model performance issues and recommend changes. They know what needs to change, but don’t have the tools to make those changes.
Based on this, we decided to focus on those data team members, and defined them as a new persona:
Super-Optimizer
Currently a Kelvin data team member, but a role that we expect clients to have in the future; replaces several optimizers
Has domain expertise and understands the basics of control models; does not code
Diagnoses and adjusts control model parameters; could write simple if-then models from scratch
Cares about control model adaptability
Use Cases
We identifed several key user needs that we could address as part of this project. Super-optimizers want to:
- Enable control models on new wells and tune them to work for new environments, equipment, and client needs.
- Easily see whether a model is performing optimally on a given well, and diagnose issues.
- Give clients transparency into how successfully models are running and what changes are being made.
App Architecture
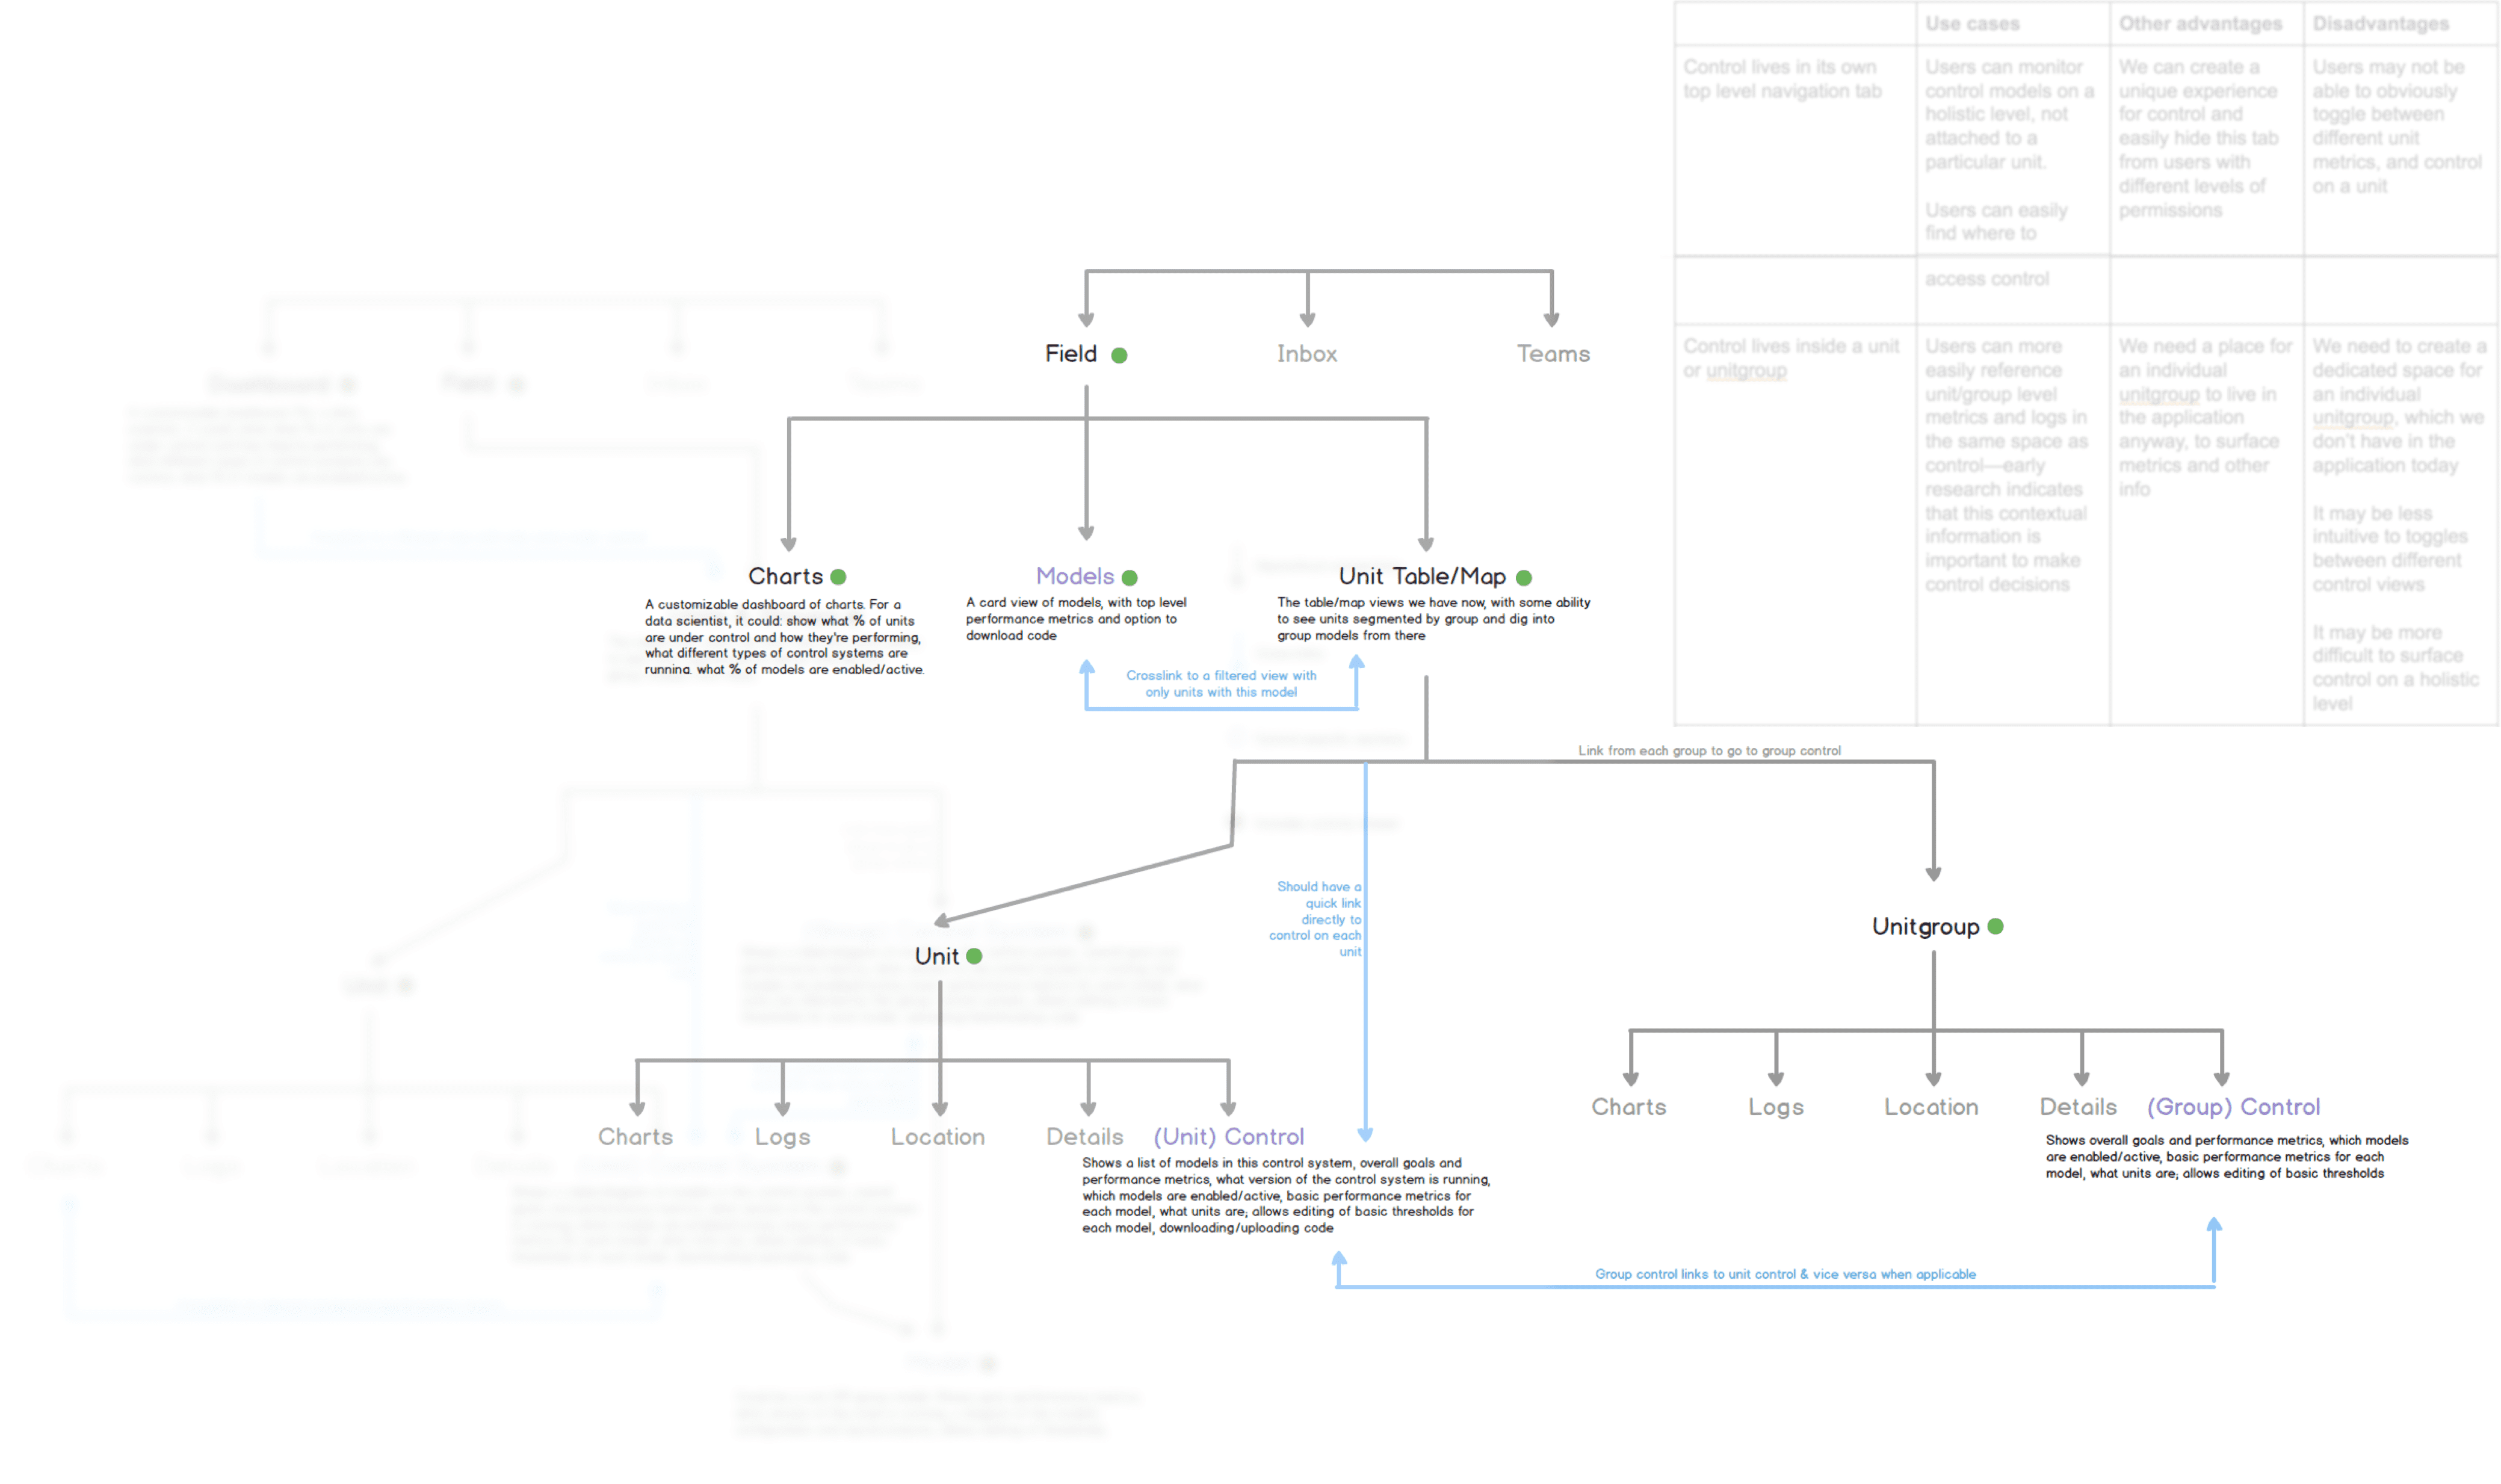
I created some diagrams to show how models could fit into our existing application. Though most of this was scoped out for V1, on a high level I wanted to make sure we were setting ourselves up for future iterations.
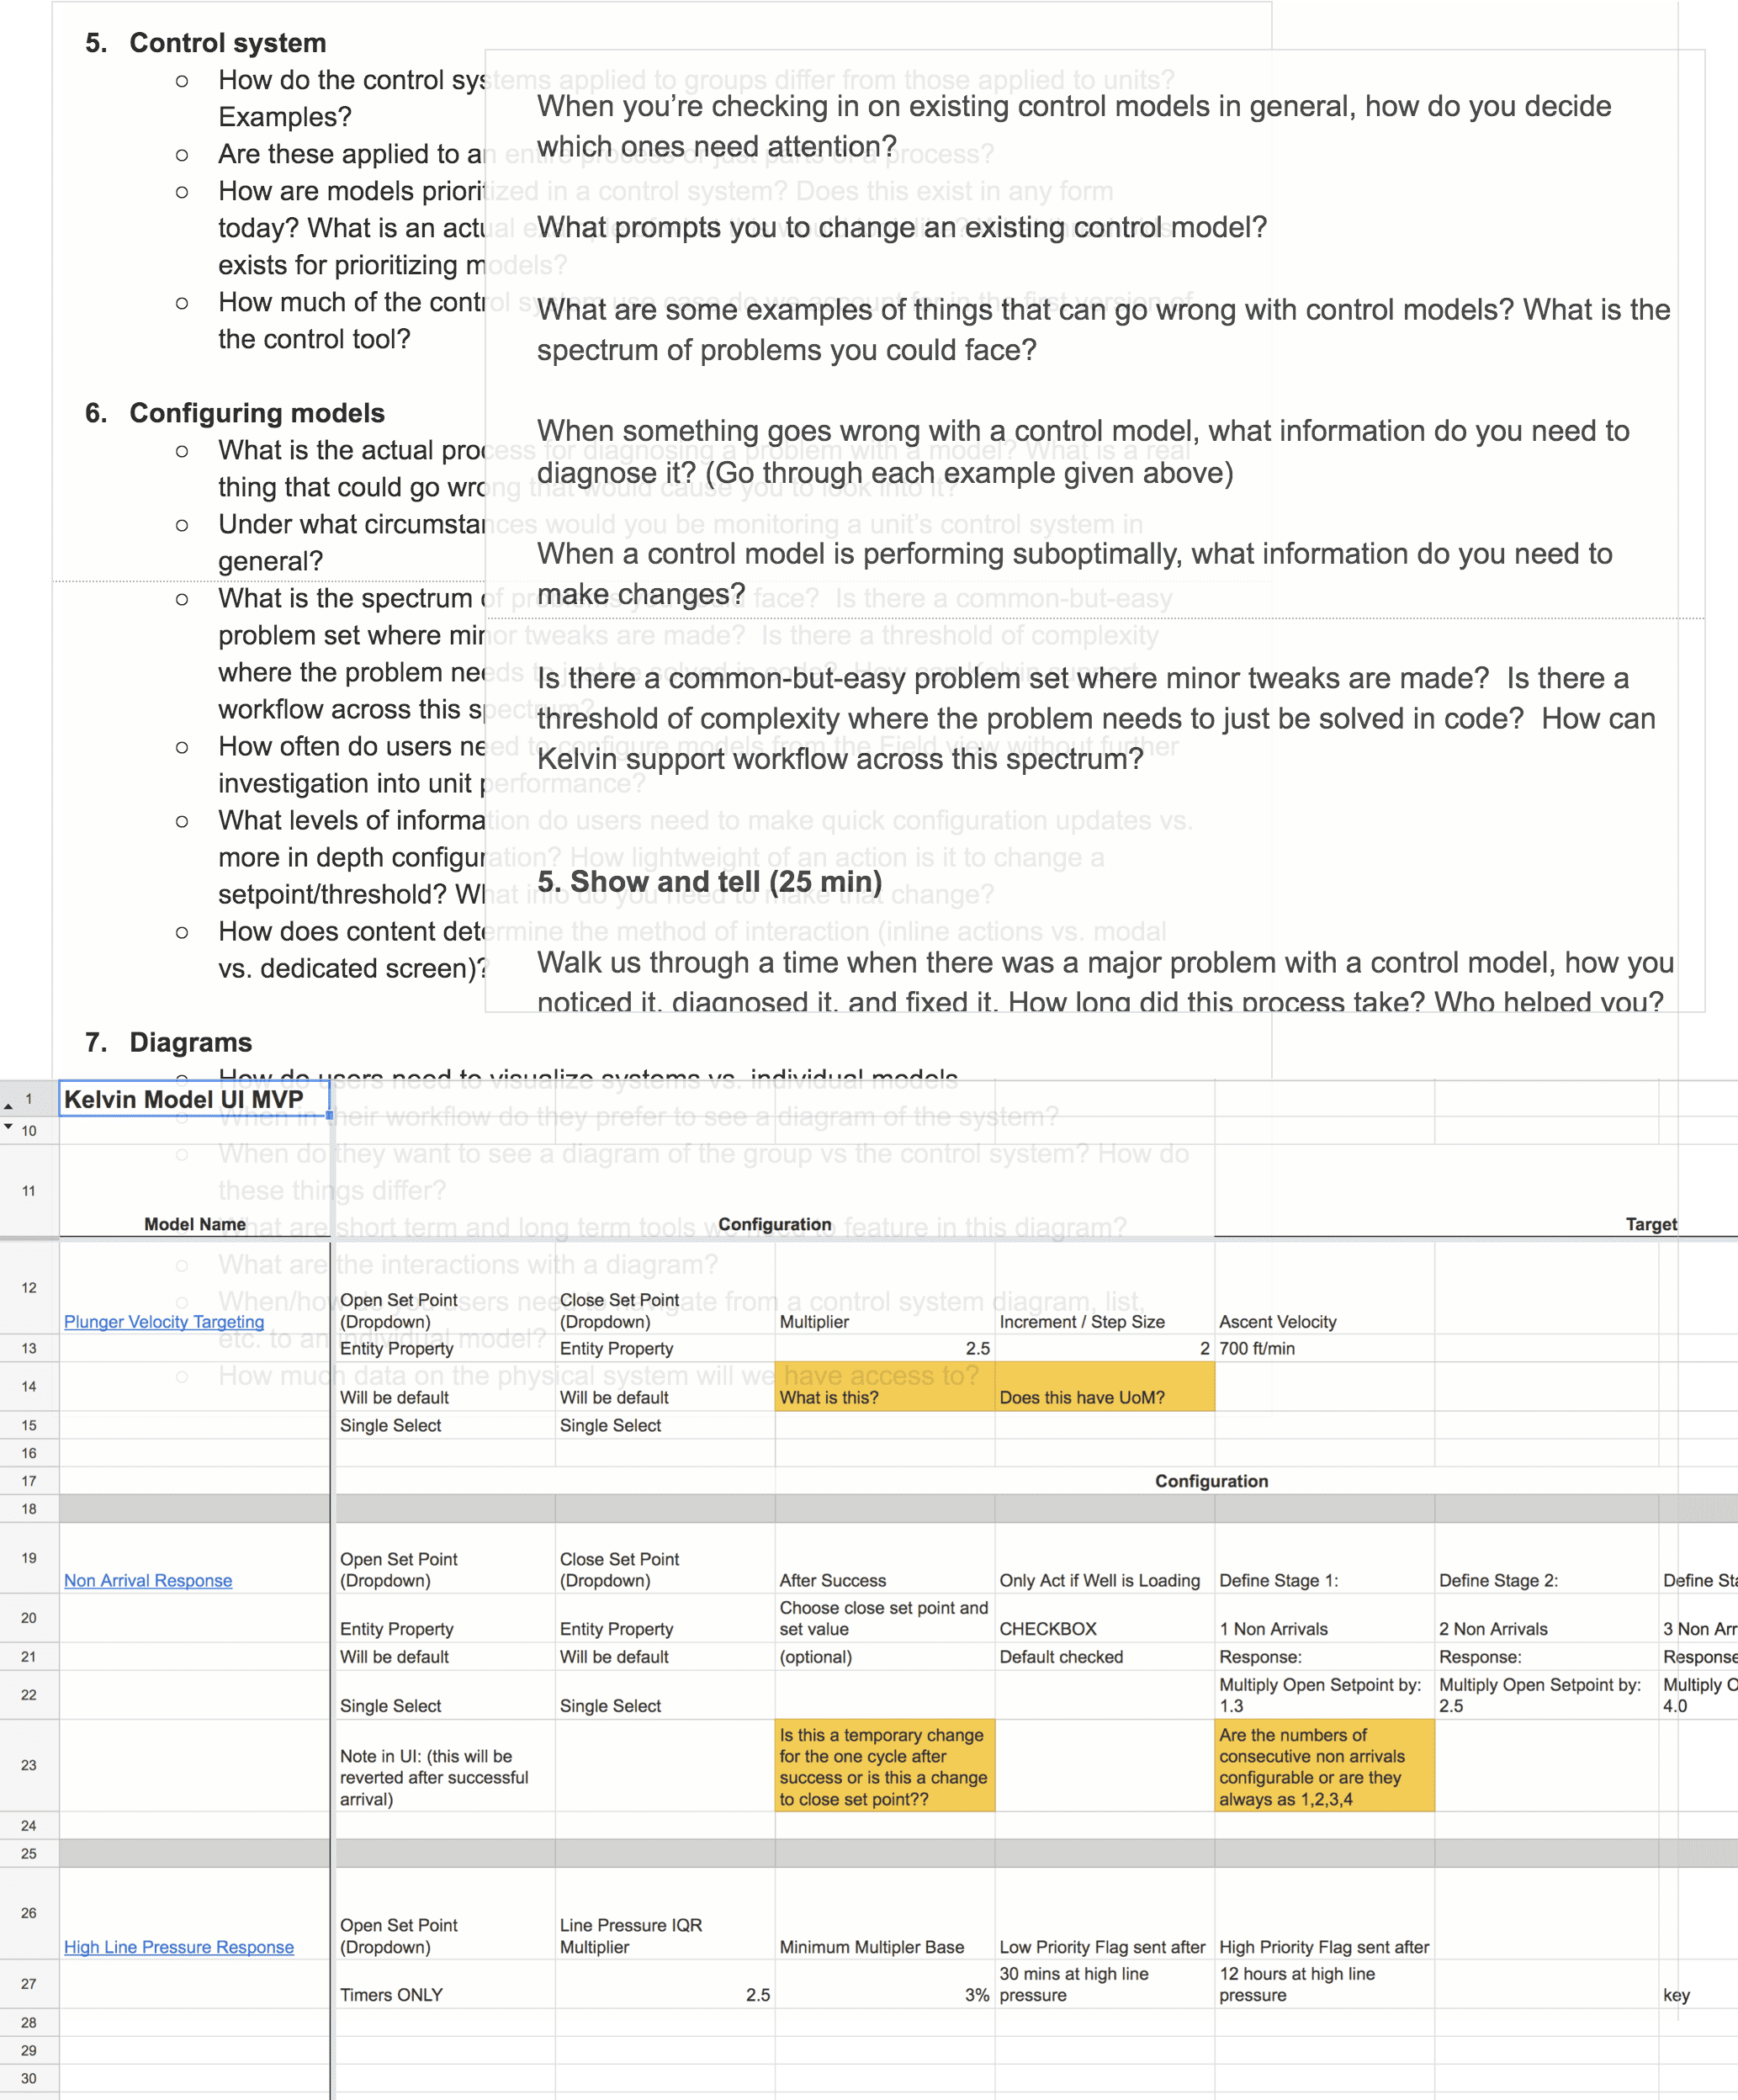
Model Content
A big piece of this project was determining what actually needed to be shown and edited for our control models. It was a long process of interviews and information-gathering sessions with the data team to figure out:
- How do users tell if a model is running suboptimally?
- What parameters exist on each model, and how much should we show to users?
- What context do users need to actually change a model parameter?
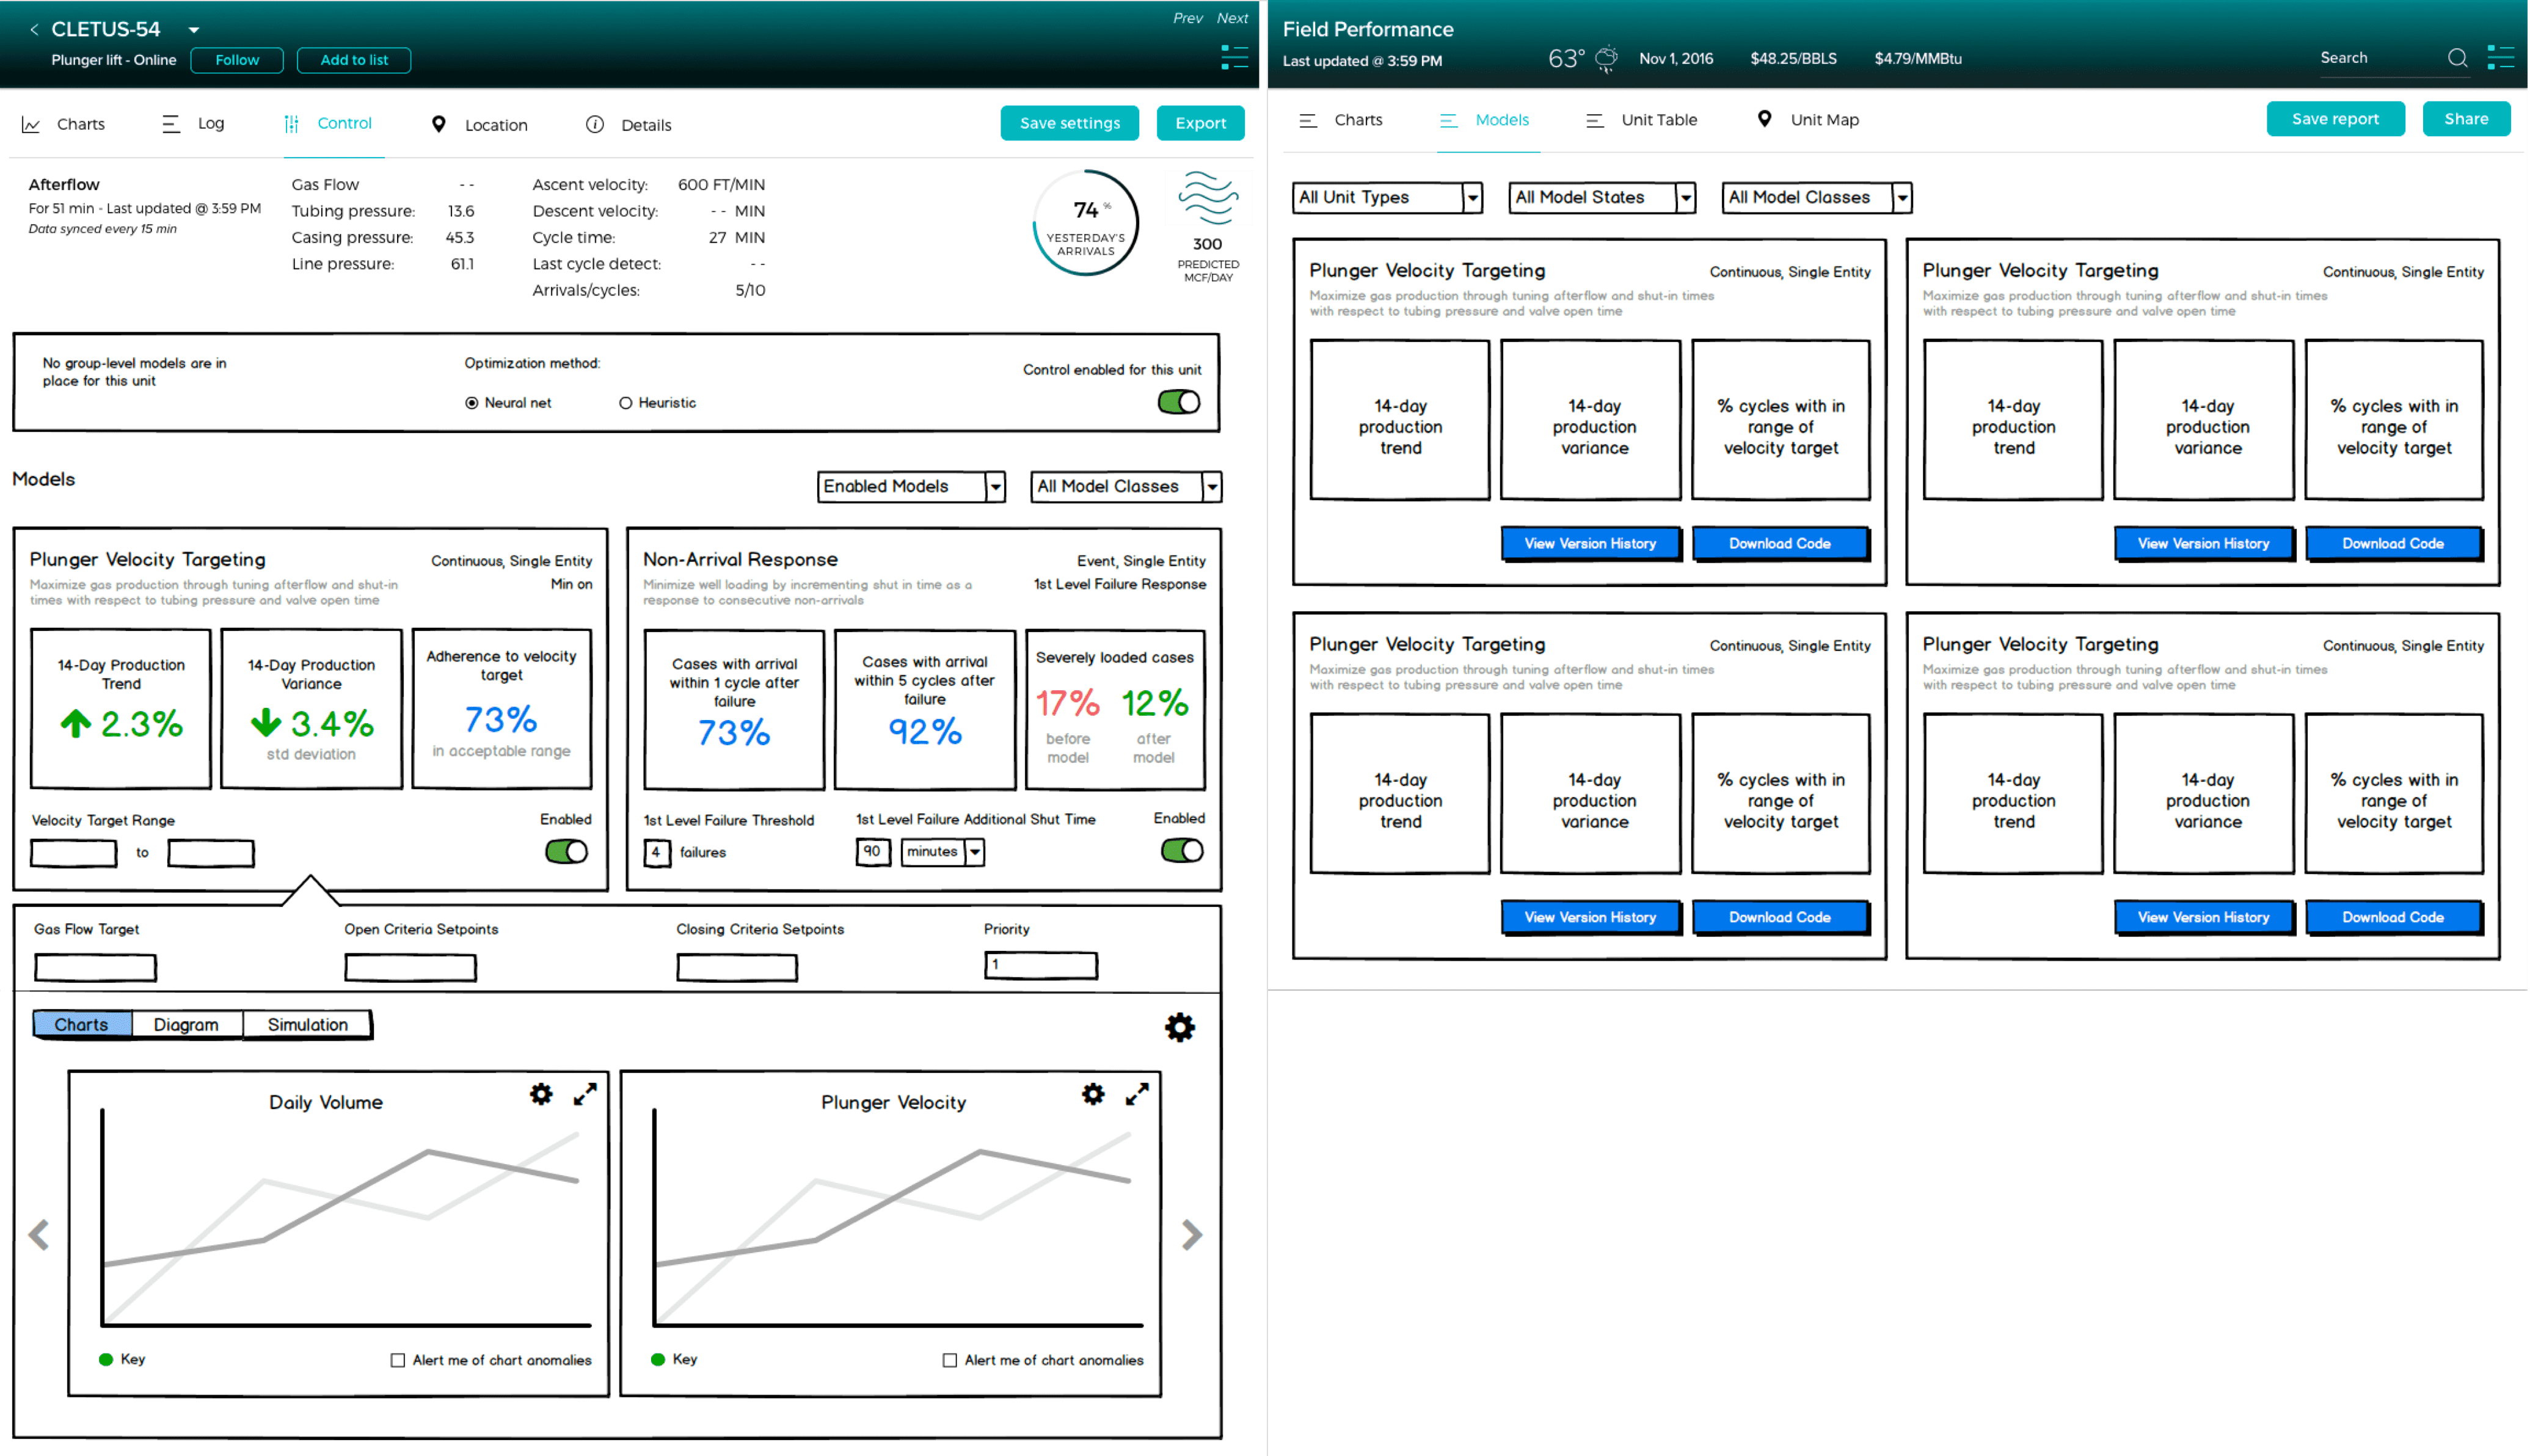
Initial Wireframes
I wireframed some of these views to illustrate our first draft of functionality and model content. We did around of lightweight feedback from the data team with these and got good feedback on content and language.
Left: control models on a specific well. Right: overview of models for all wells
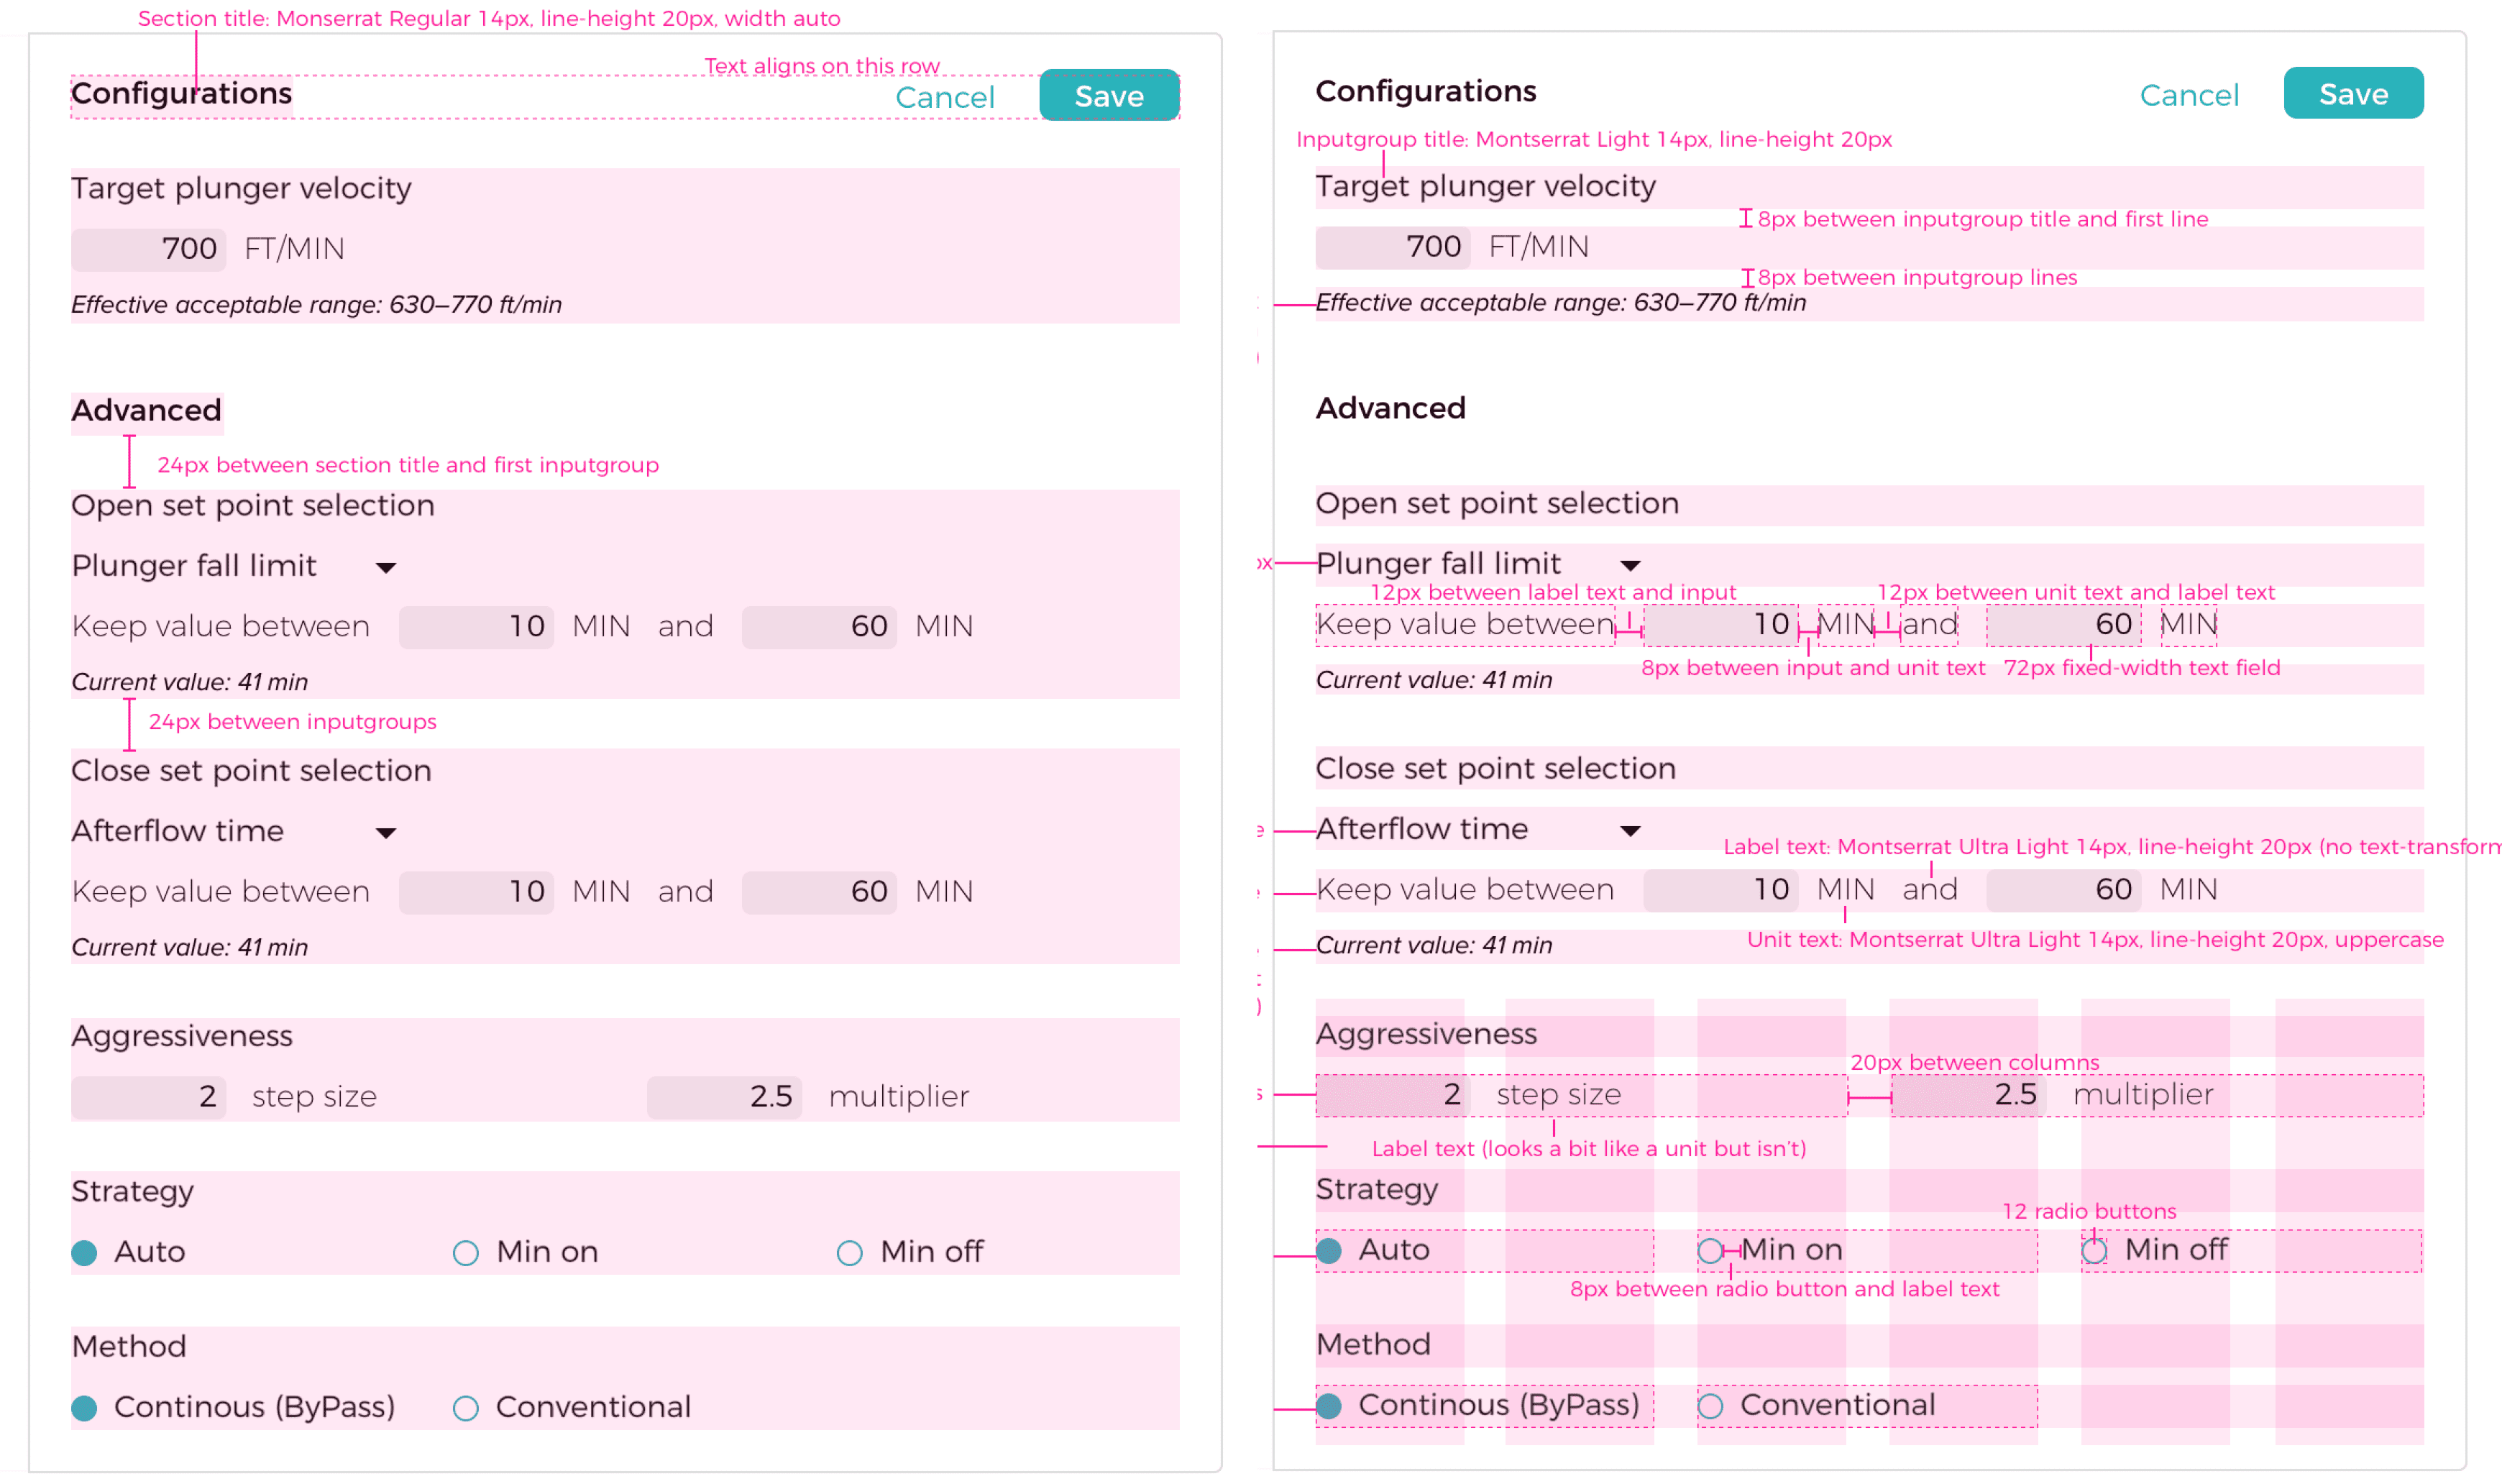
High Fidelity and More User Testing
I knew that the super-optimizer needed to reference RTU settings to make model parameter changes, so initially I put them at the top of the screen as an expandable gray box. This felt a bit clunky, and when it was collapsed users mistook it for a header.
From feedback on these mockups, I was able to narrow down exactly what information was needed for each model parameter so I could refine this.
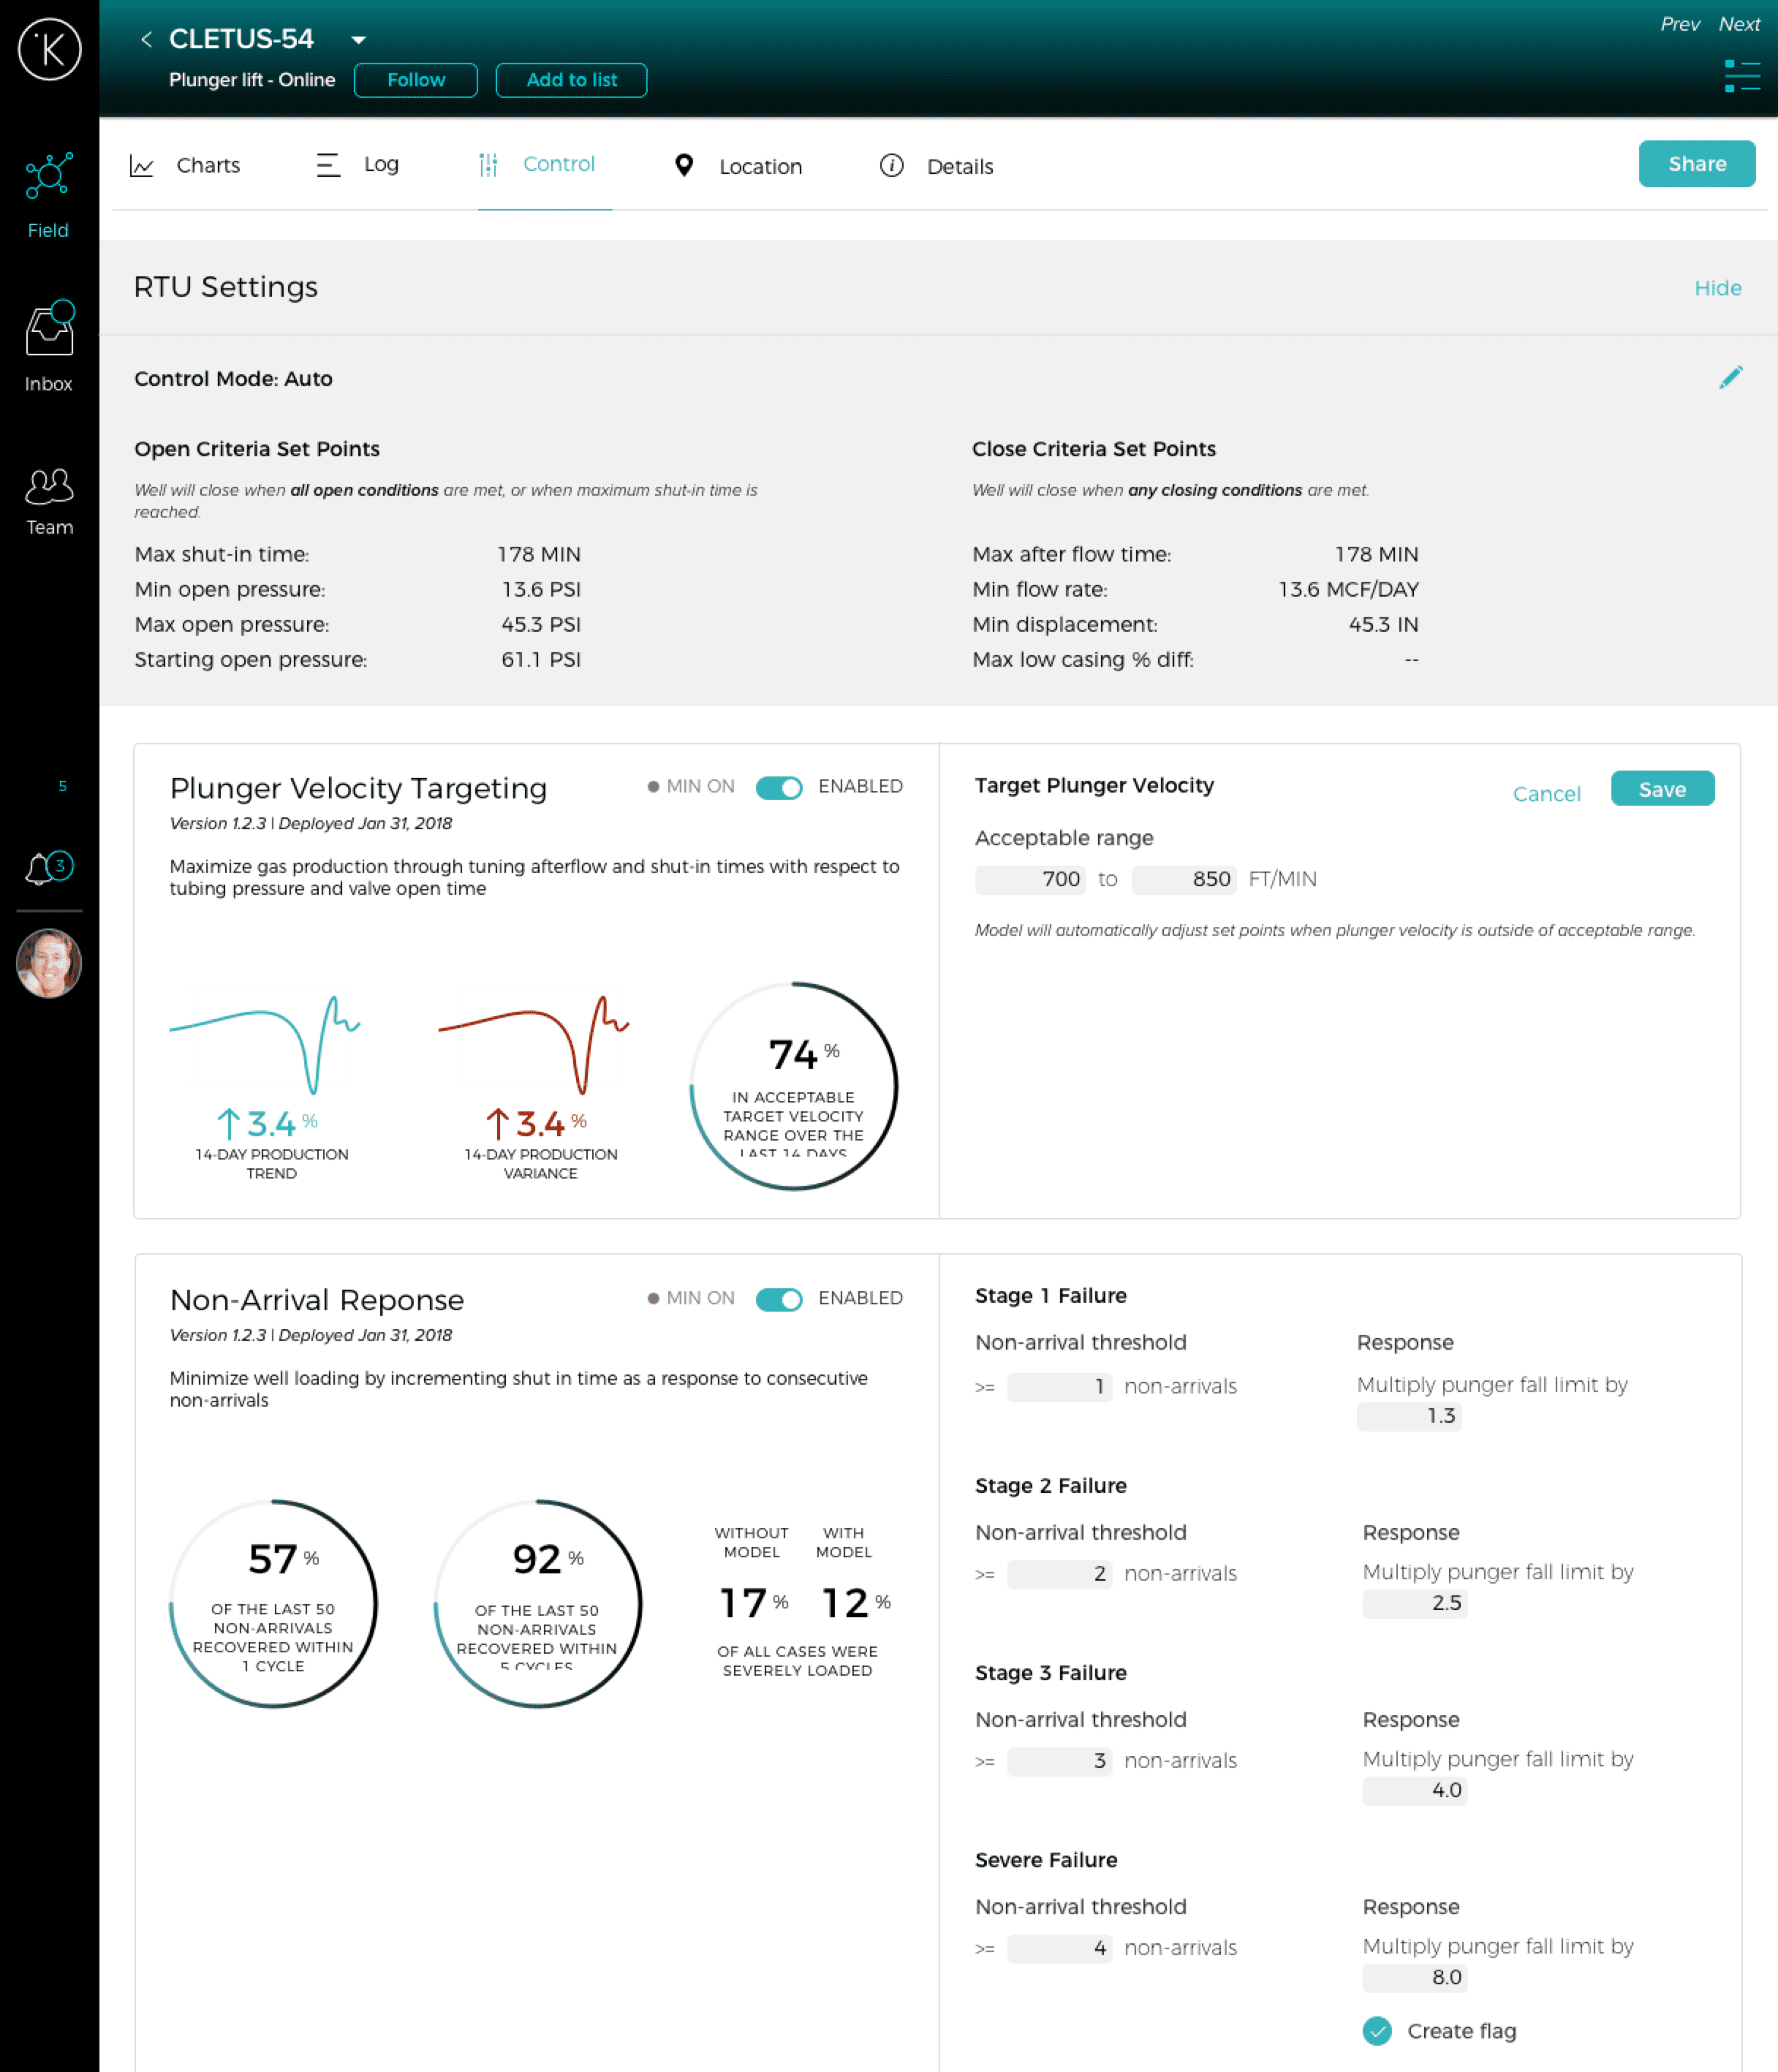
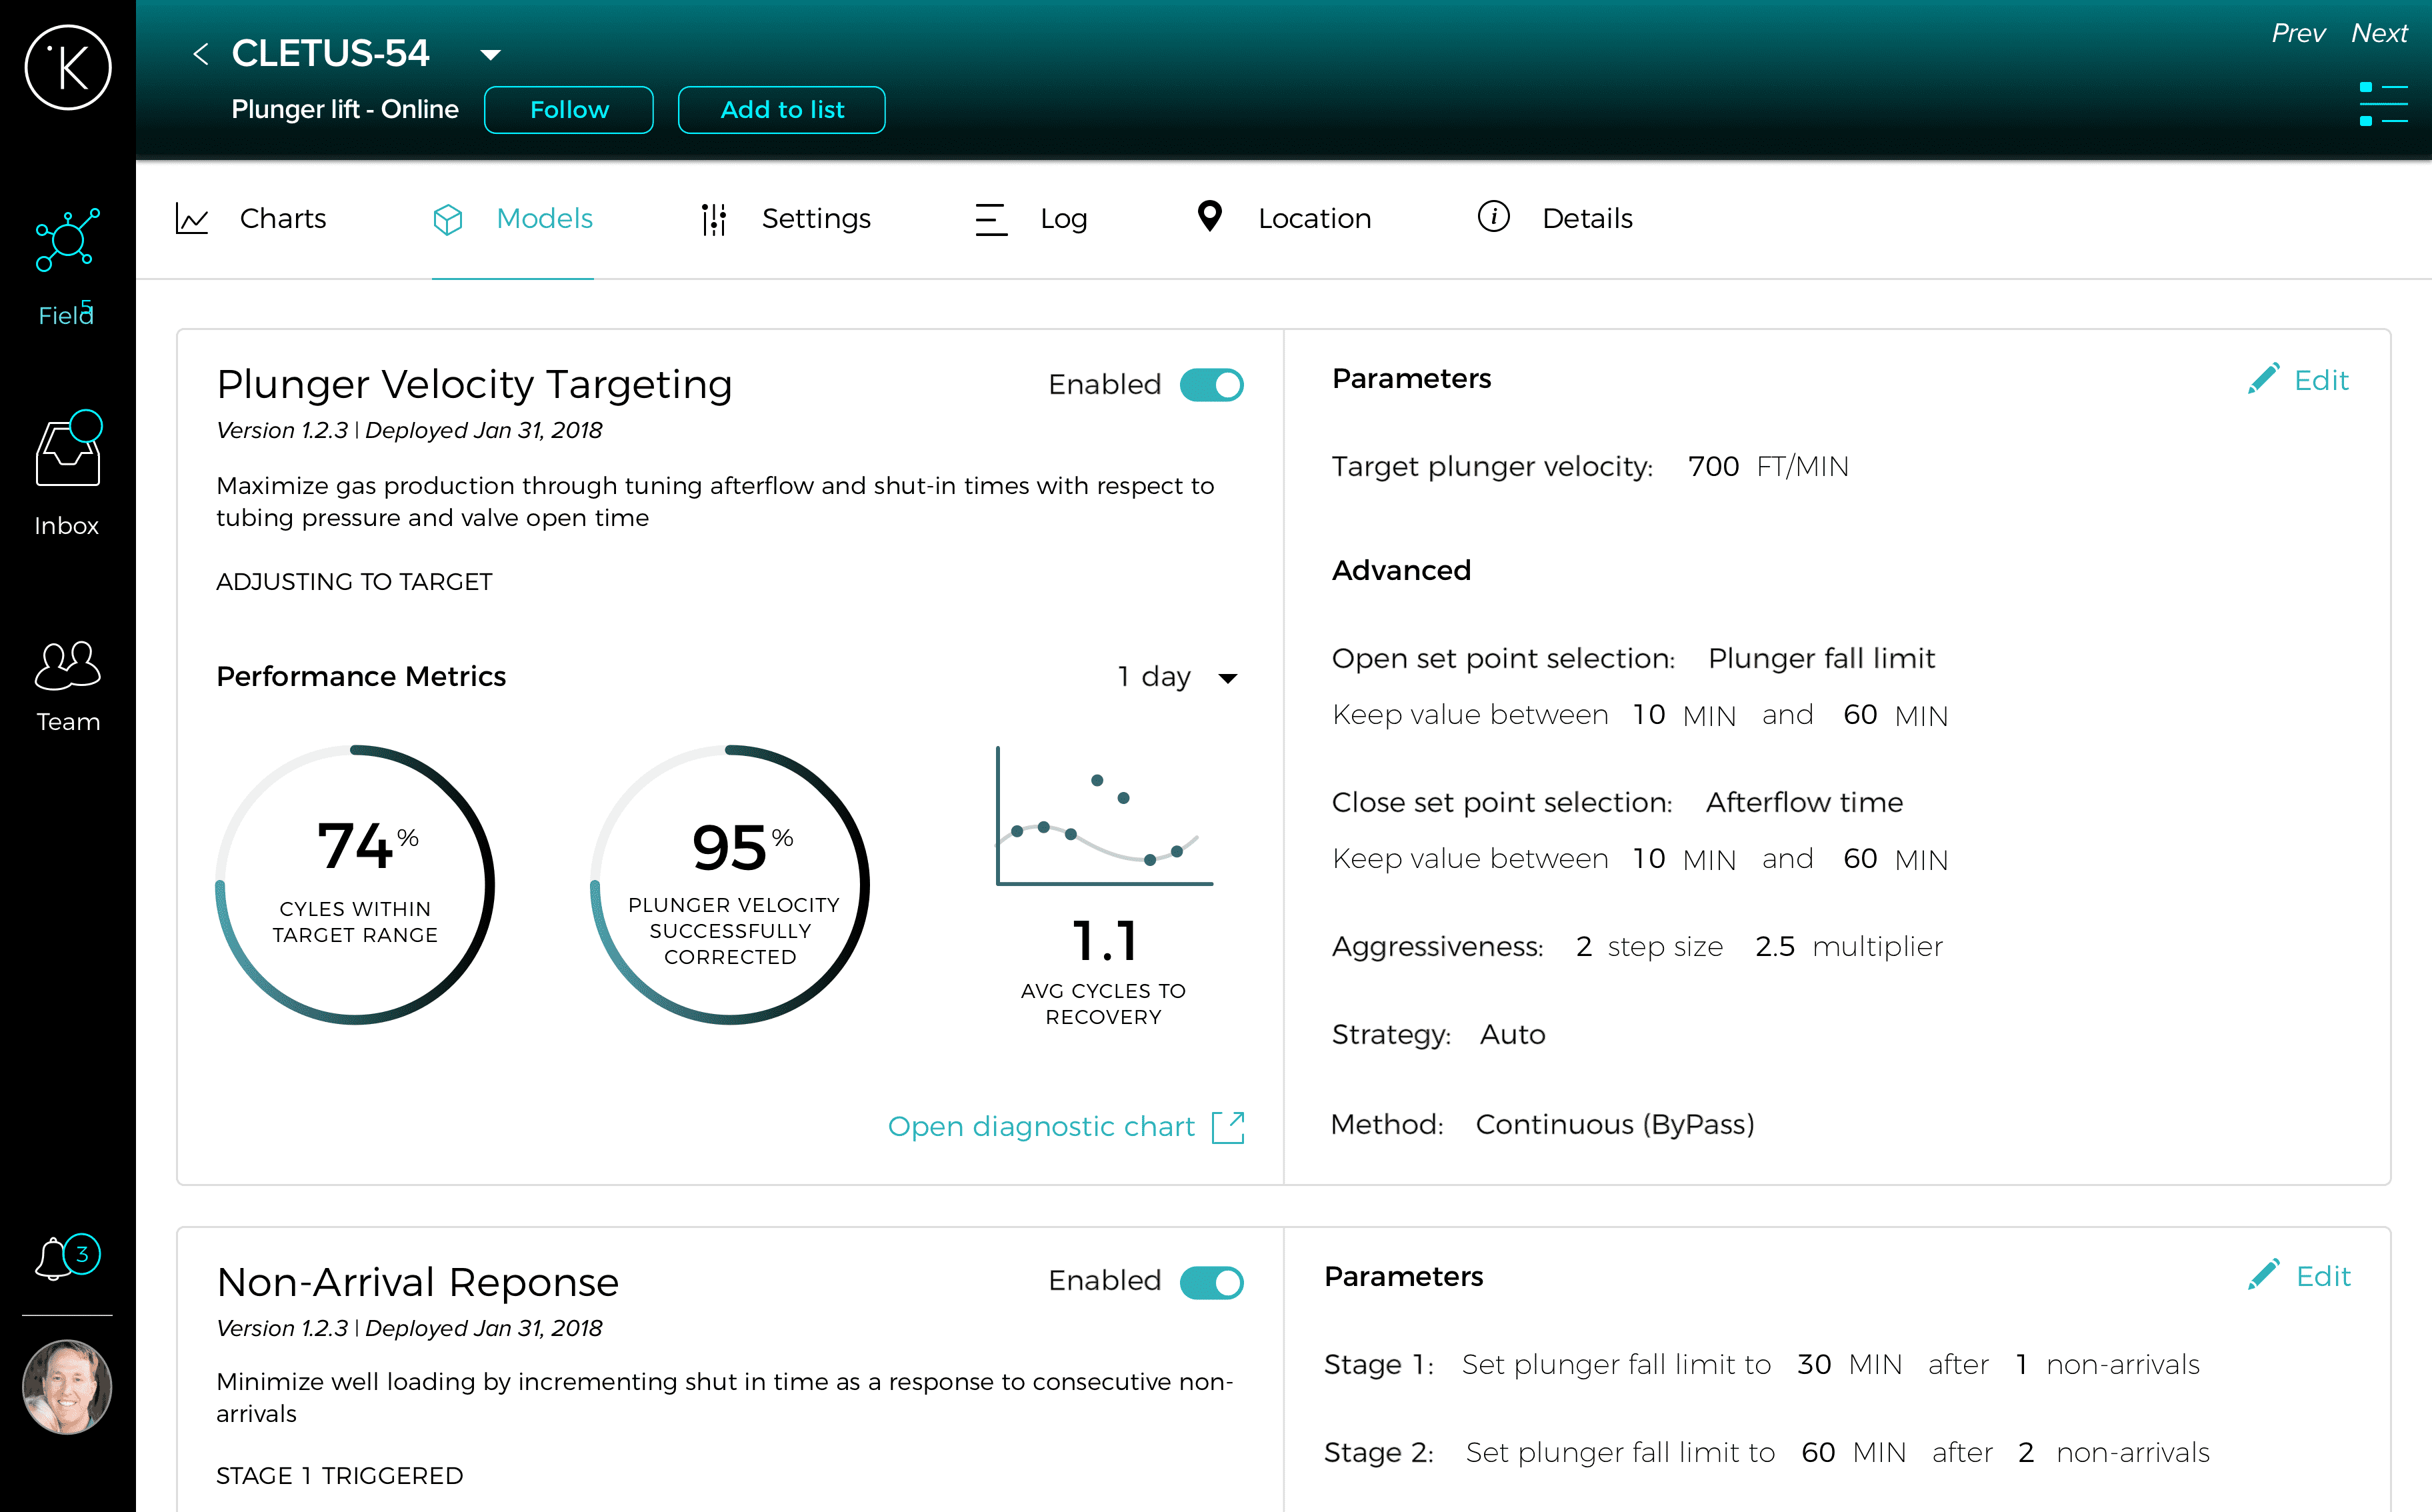
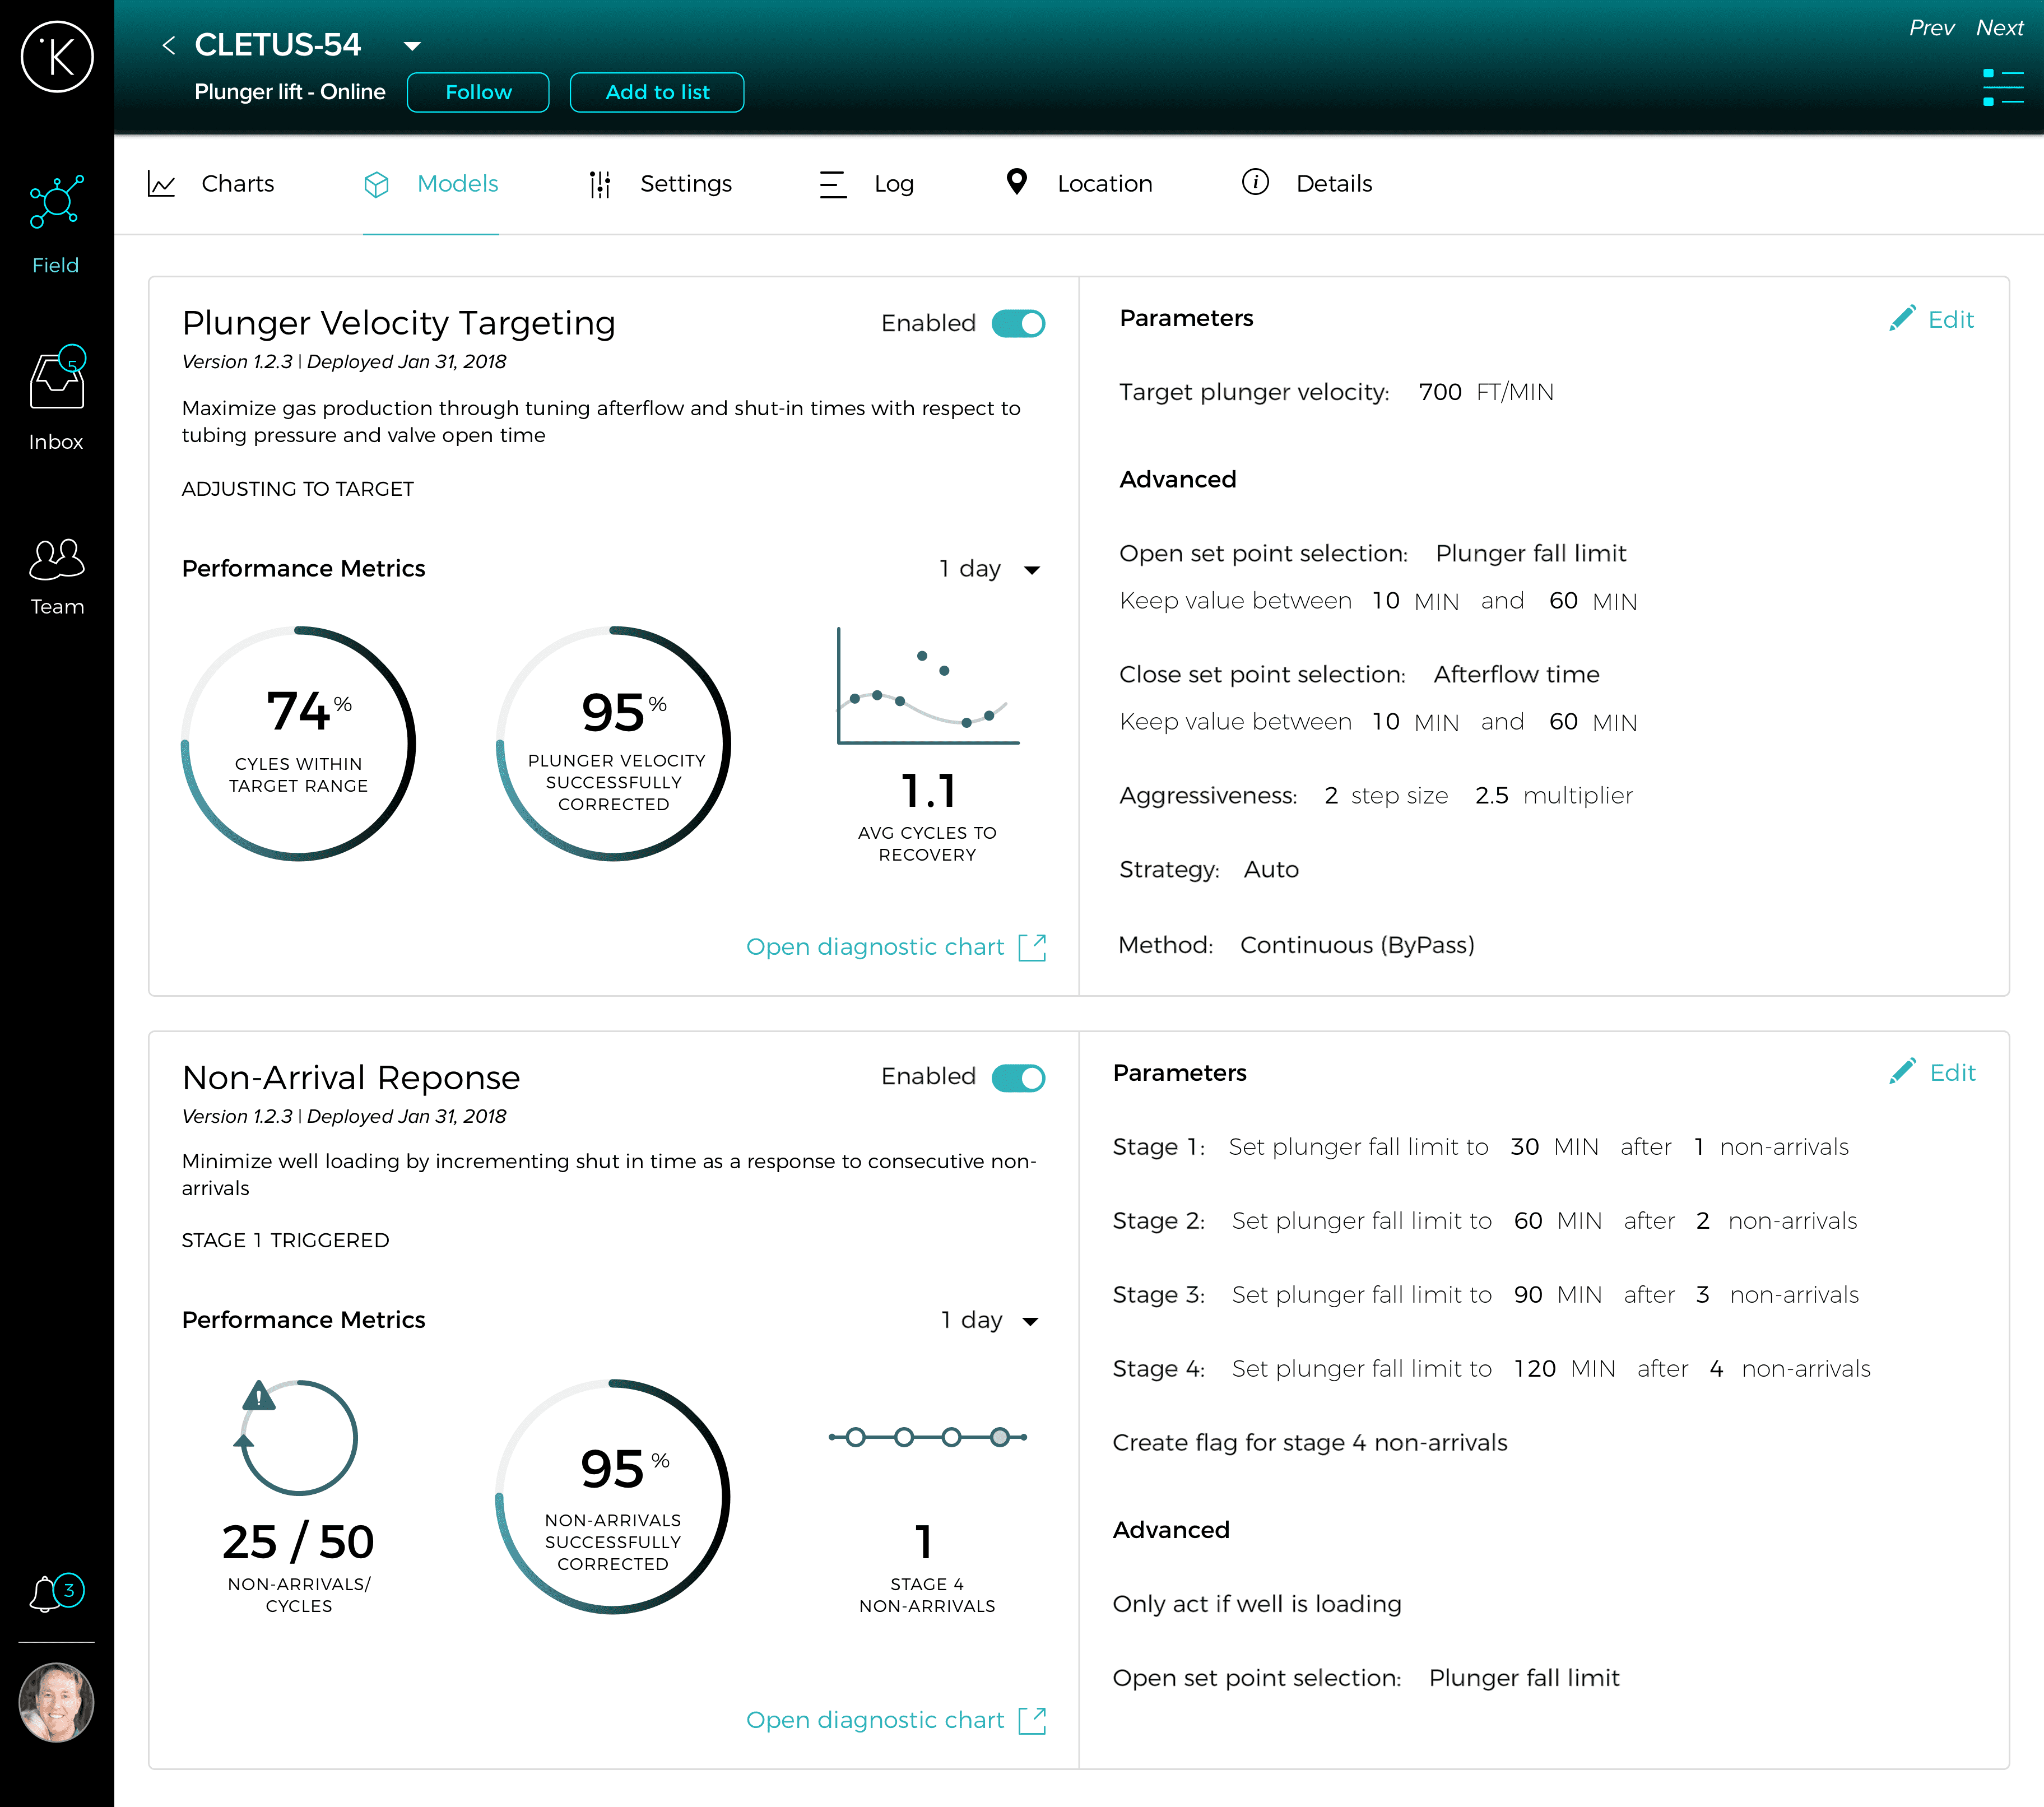
Final Design
Model parameters are shown side by side with performance metrics to help inform the user’s decision.
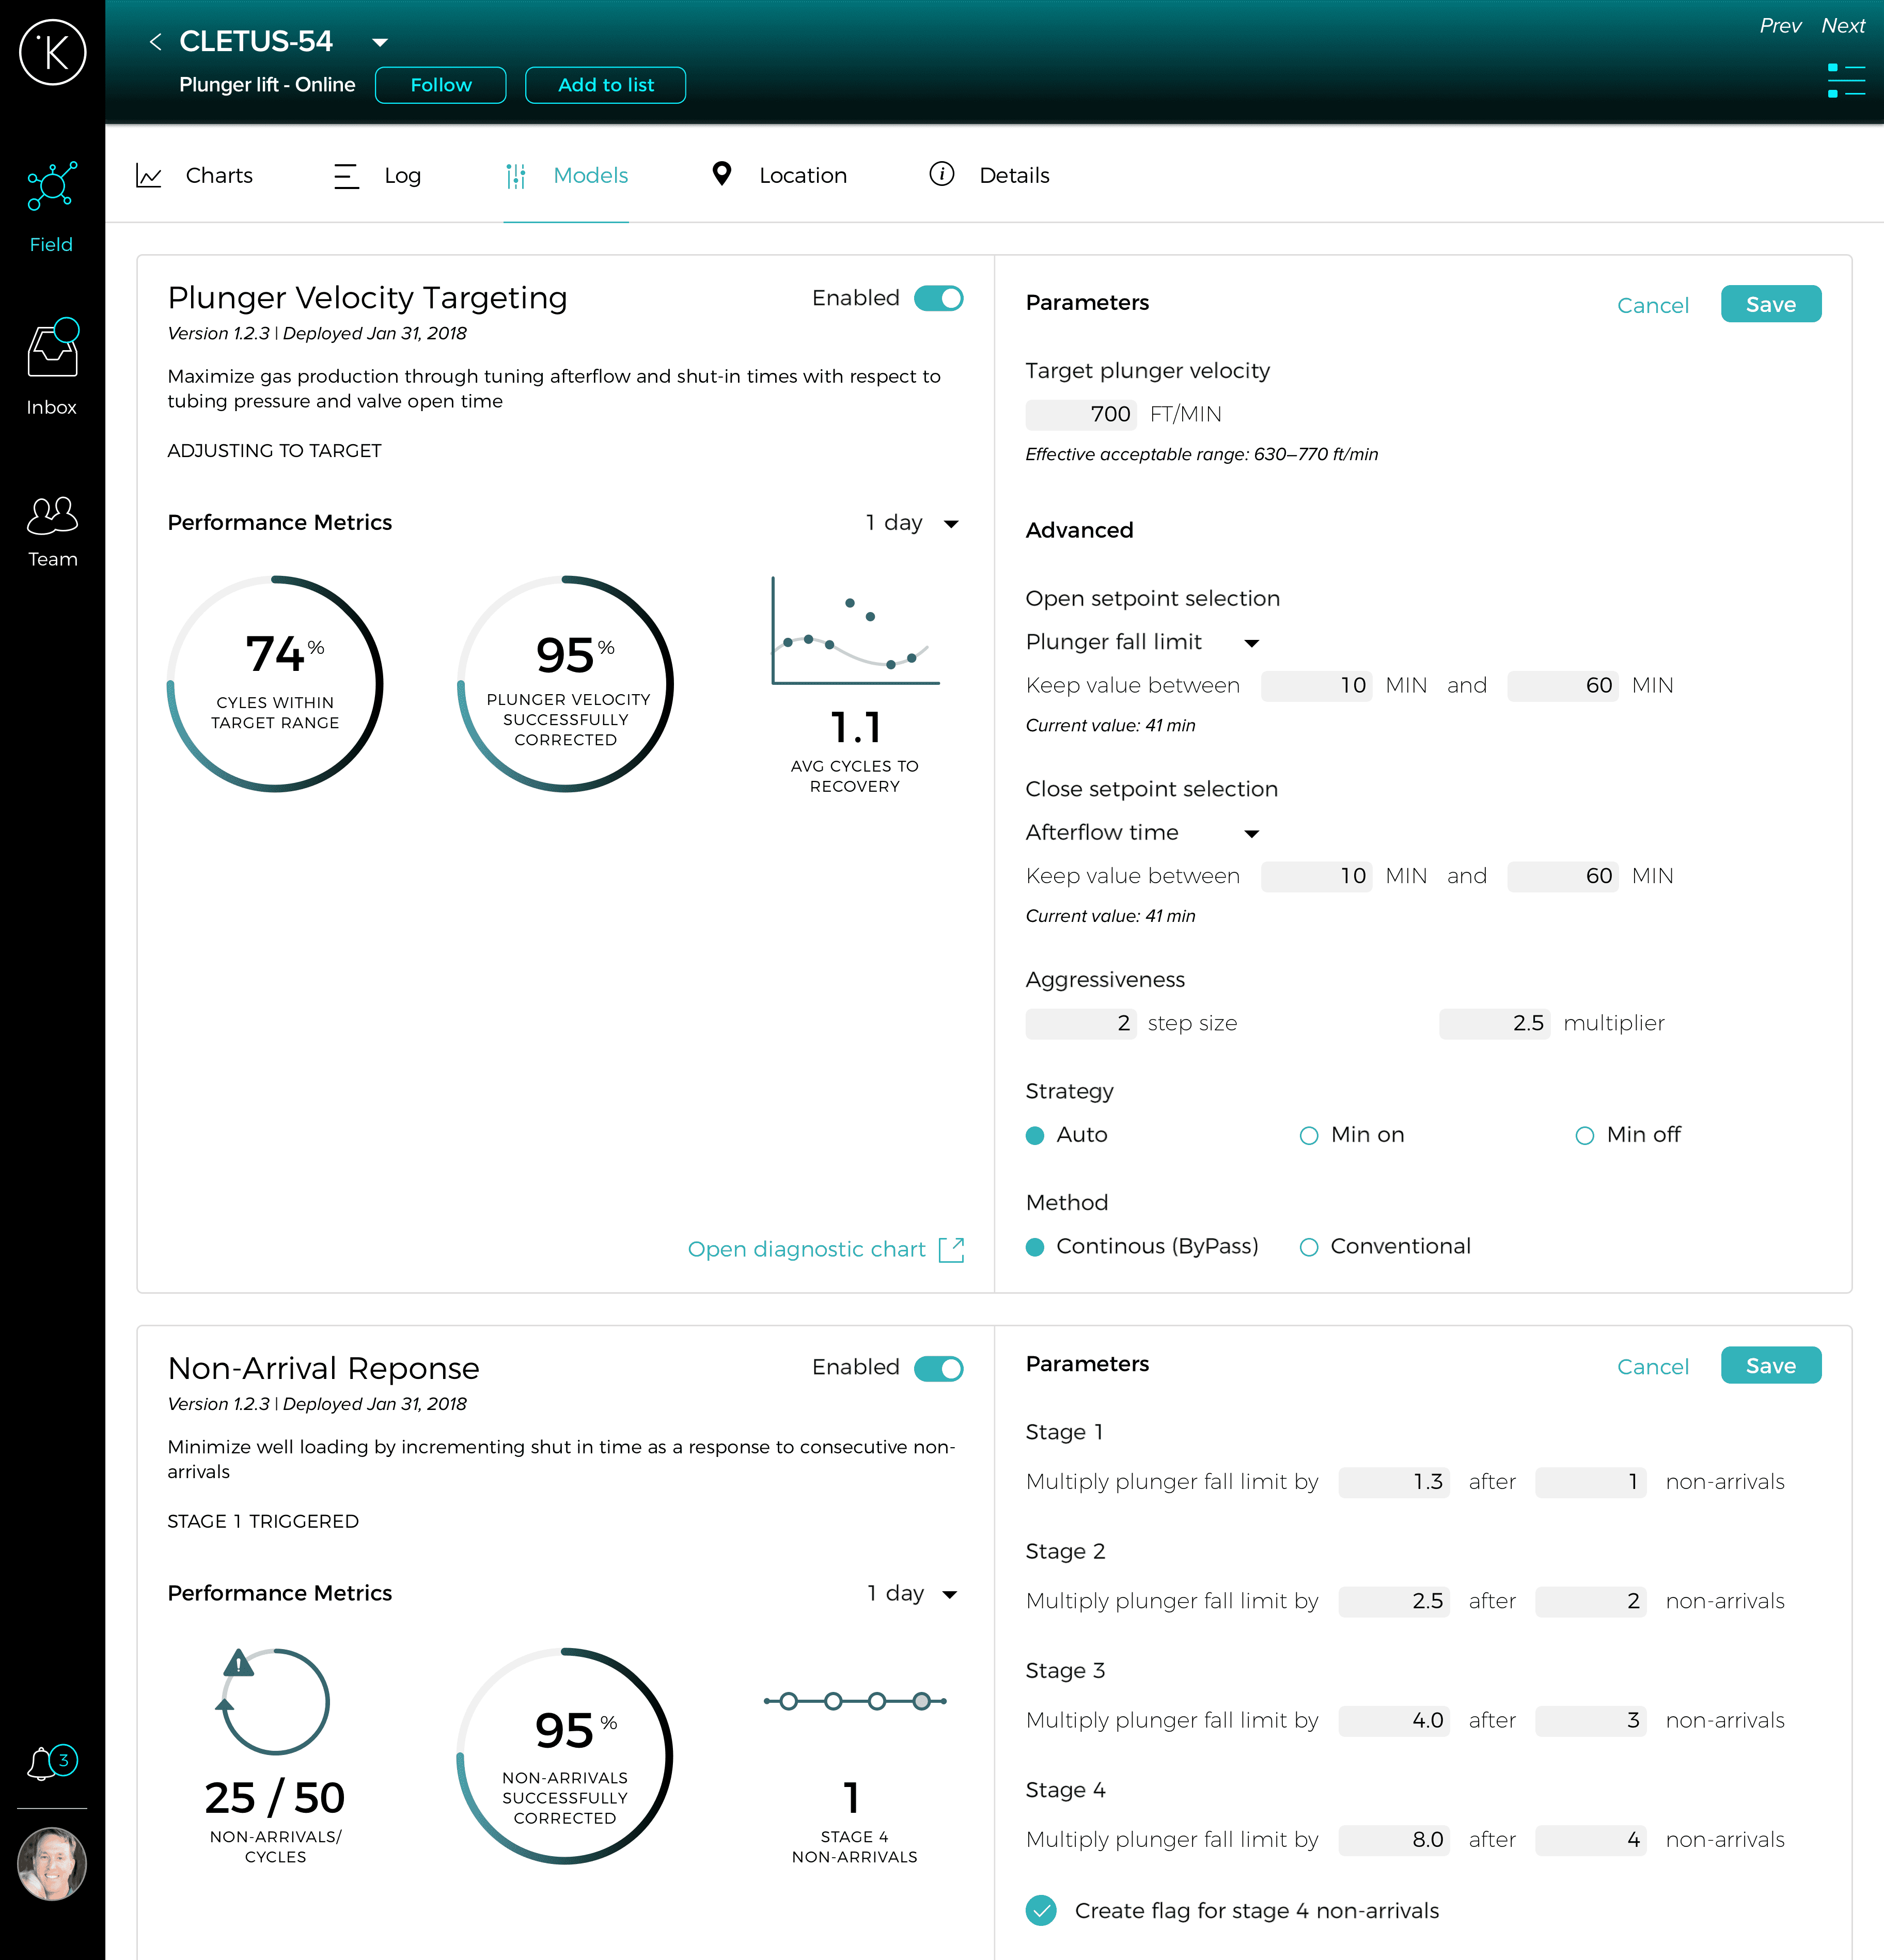
Edit mode
Editing a model reveals additional context in the form of calculated and current values.
These are the RTU settings that were at the top of the screen in the last mockup
Measures of Success
We recently released this internally and to all clients. It’s still early but we’re hoping to:
- Decrease the time it takes to tune models for new wells
- Give clients transparency into what model changes are being made
- Learn clients’ current level of interest in tuning their own models
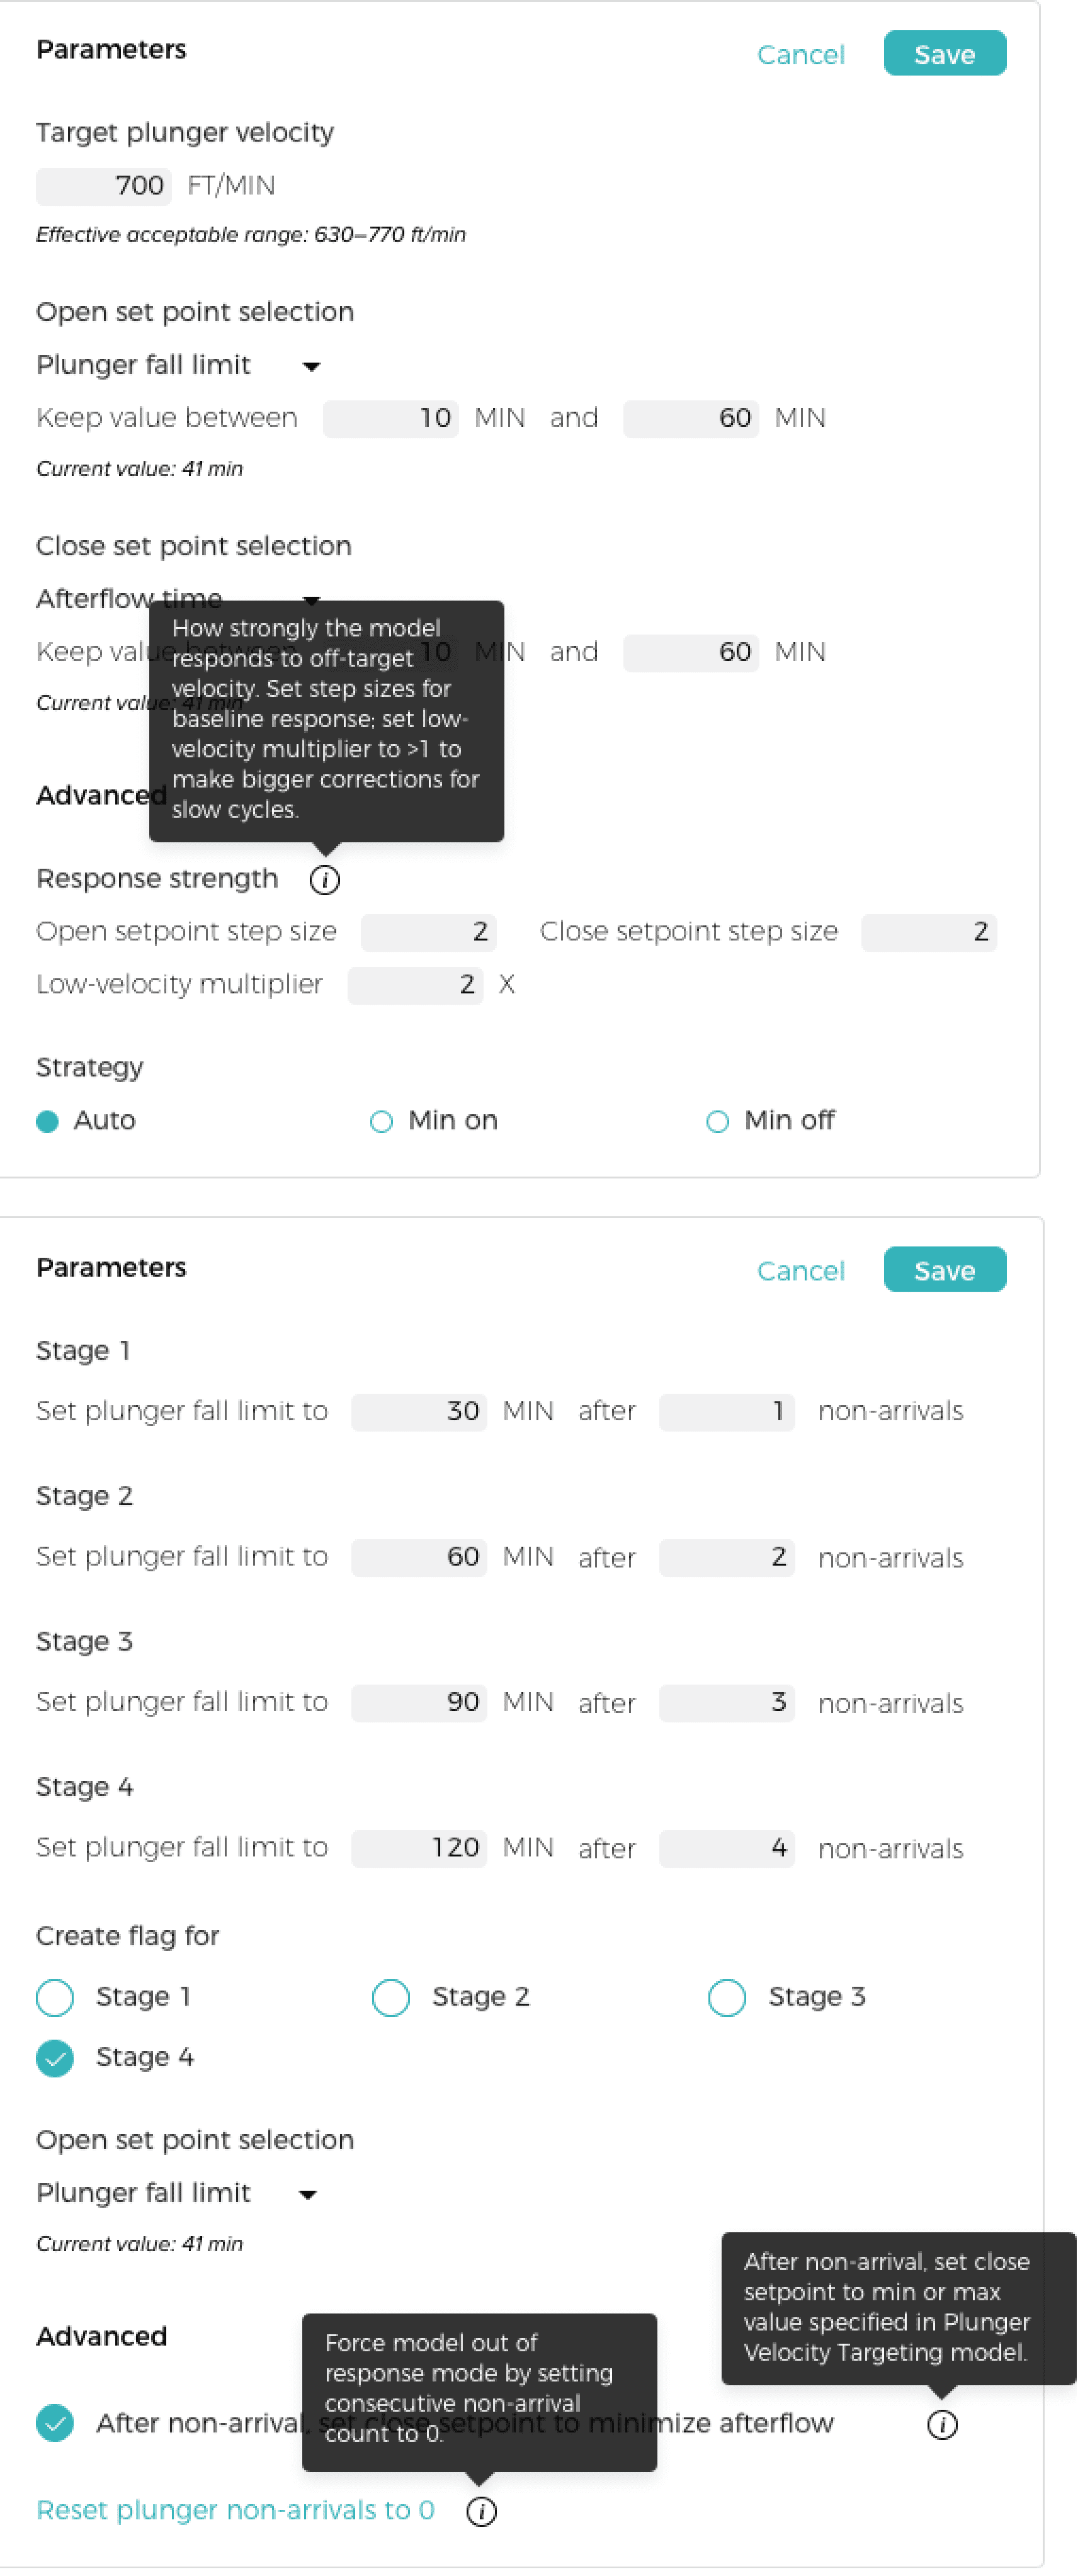
Followup Improvements
As development started, we realized that we needed to think in a more modular way with our layouts to support new models in the future. I worked with the development team to create components that could be built from a JSON file.
As we were rolling this out to production, there was some confusion about what each parameter means. This especially came up in training people who weren't familiar with the models. We added a tooltip component that could be added to the JSON, and I worked with the data team to get the language right.